 Canada - FR
 U.S. - EN
Portfolio Update
September 2026
Global equity markets have adjusted modestly this month, factoring in inflation concerns amid the continuing conflict in the Middle East. As of August 31st, the S&P 500 returned 14.4%. the S&P/TSX 16.0%, the MSCI ACWI 16.2%, the MSCI EAFE 15.6%, and the MSCI Emerging Markets 25.5% year-to-date in Canadian dollars.
Attention has also turned to renewed U.S. tariff announcements on Canadian goods. New 50% tariffs on approximately $28bn of Canadian goods affect approximately 5% of Canadian exports to the U.S., while the vast majority of Canadian exports – approximately 80% – remain protected under CUSMA and continue to enter the U.S. tariff-free. In our view, these announcements do not change the trajectory of the Canadian economy. We continue to expect subdued, but positive, growth, with real GDP advancing in the range of 1-2% this year and next. Trade uncertainty around tariffs and CUSMA renegotiations remain a complicating factor, but activity continues to be underpinned by resilient consumer spending and supportive fiscal and monetary policies.
Rising Yields: A Global Phenomenon
Bond markets have taken center stage, as a sharp global sell-off pushed yields to multi-year, and in some cases, multi-decade highs. The most has been swift and broad-based, reflecting a convergence of pressures: persistent inflation, heavy government borrowing needs, and renewed geopolitical risk. As of September 8th, the 10-year U.S. Treasury yield reached 4.79%, its highest level since late 2023, while the 30-year touched 5.25%, near its highest level since 2007. Canadian yields have moved in tandem, with the 10-year Government of Canada bond climbing to 3.80%, its highest level in over two years.
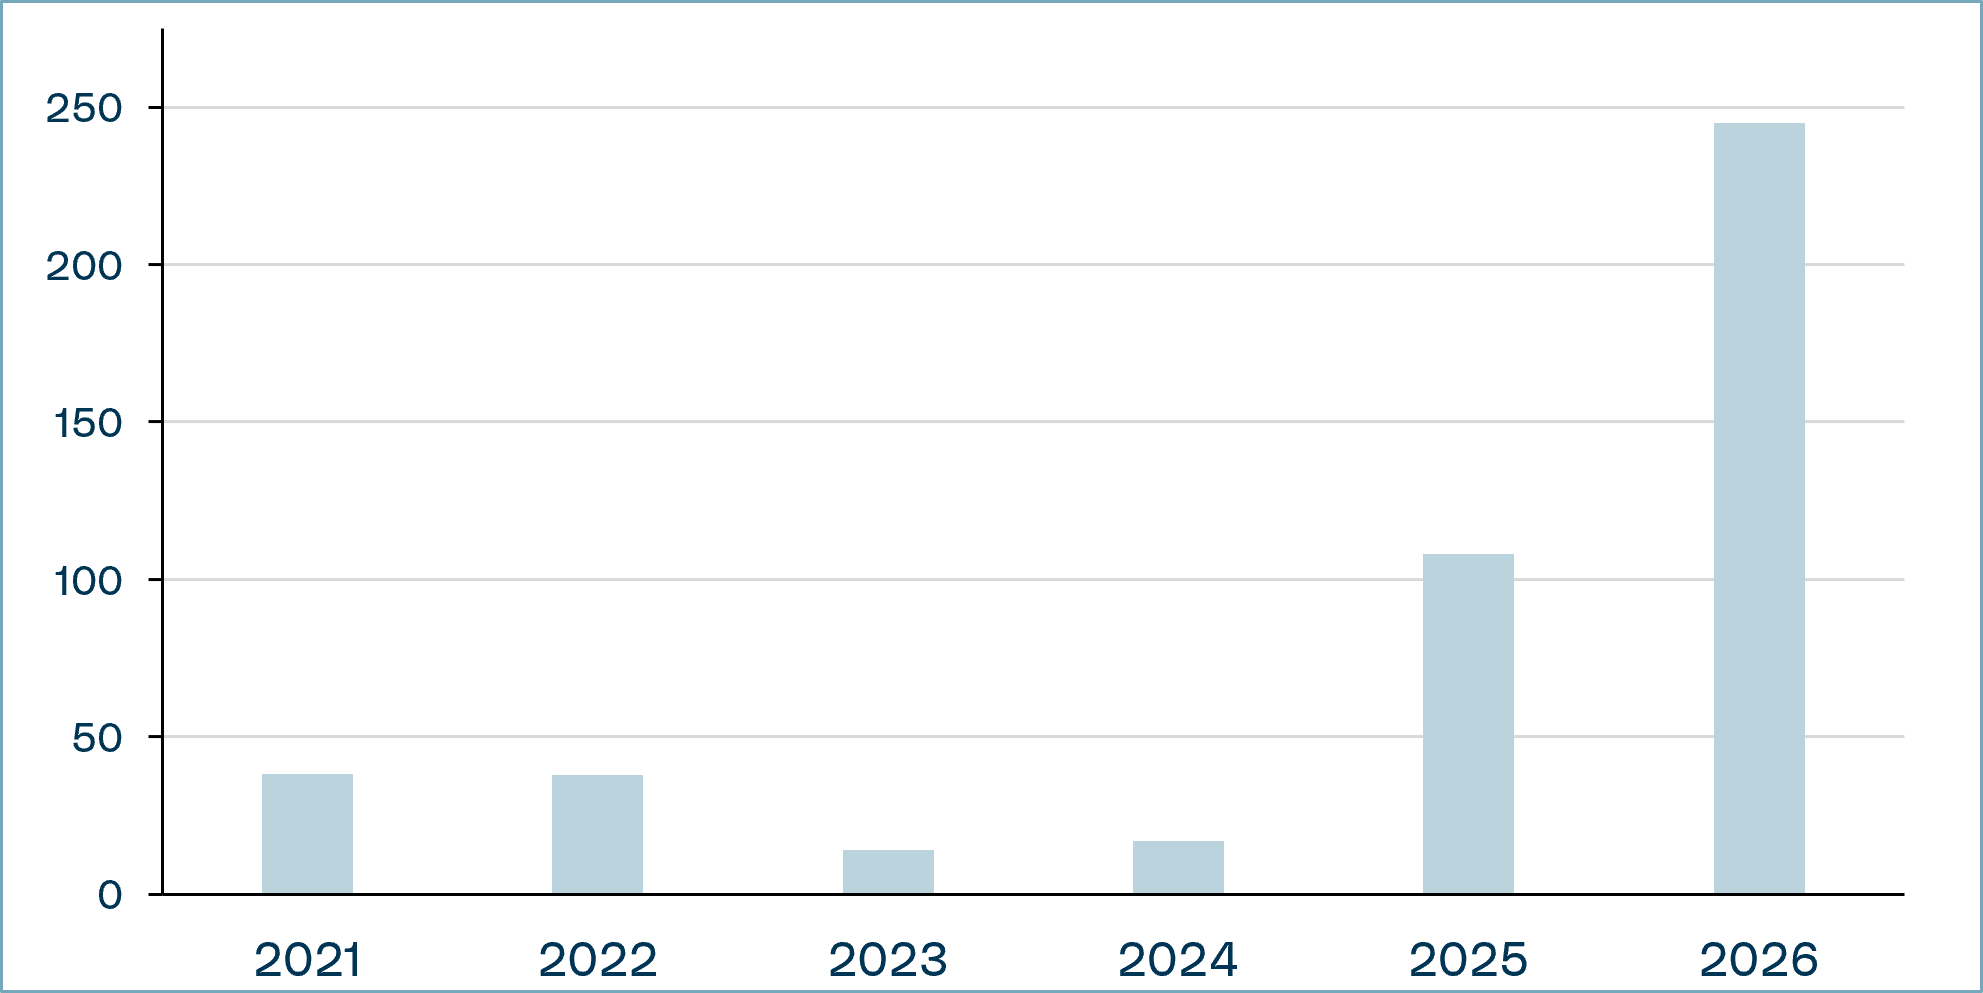
While stubborn inflation and renewed conflict with Iran have contributed to the move, we believe the more structural driver lies in heavy government borrowing needs and the wave of issuance required to fund them. The U.S. federal government continues to borrow heavily, with federal debt surpassing $40 trillion for the first time. At the same time, major technology companies have issued roughly $220 billion in debt this year alone to fund AI-related investments, including data centers, adding further to the supply investors must absorb.
Fundamentally, this repricing reflects an issue of supply. Federal, corporate, and AI-related debt issuance are converging simultaneously, and the resulting volume of new bonds is placing considerable pressure on yields across the curve. With government and corporate borrowers competing for a limited pool of savings, the market is being asked to absorb a greater volume of debt than it has in years, and higher yields are the mechanism by which that additional supply is being cleared.
Hyperscaler Global Bond Issuance
Positioned for a Higher-Yield Environment
While this additional supply is placing pressure on yields, we believe our portfolios remain well positioned to navigate the current environment. As yields have continued to creep higher, we have been gradually extending duration, adding incrementally to intermediate-term bonds at increasingly attractive levels. Importantly, this extension has been made into rate-expectation volatility rather than against it, allowing us to take advantage of dislocations as they emerge rather than fighting the prevailing trend. We continue to hold no exposure to bonds with maturities beyond 20 years, which has kept our portfolios largely insulated from the sharpest losses at the long end of the curve. This approach builds on our broader strategic decision to maintain a shorter duration in bonds within our bond portfolios, complemented by active curve positioning and a high-quality credit profile, with no exposure below BBB and a meaningful weighting toward AAA and AA rated issuers. Together, this combination has driven our bond portfolios’ performance relative to the benchmark[1]. Throughout this period of heightened market speculation, we have remained disciplined in our valuation approach, an approach that has helped us rank within the first quartile on eVestment among Canadian fixed income (core) strategies, a landscape of 48 firms and 77 strategies, over one, three, and five-year periods[2].”
Concluding Thoughts
Our fixed income strategy has been shaped by a disciplined, risk/reward-driven approach to positioning across the yield curve, allowing us to preserve capital while limiting undue risk. Over the past five years, our bond strategy has produced an annualized return of 2.8%, compared with a 0.4% return for the FTSE Canada Universe Bond Index over the same period[3].
As heavy federal, corporate, and AI-related issuance continues to pressure yields higher, we believe our portfolios remain well positioned to navigate this environment, reflecting not only our decision to avoid long-duration exposure, but also our positioning along the curve, the credit quality of our holdings, and the securities we own. We will continue to extend duration selectively as opportunities emerge, while maintaining the price discipline that has guided our approach throughout periods of market volatility. With a continued emphasis on long-term vision and valuation, we remain confident in our ability to protect capital while positioning portfolios to benefit as the current supply dynamics evolve.
[1] The benchmark since inception is 5% FTSE Canada 91 Day T-Bill Total Return Index and 95% FTSE Canada Universe Bond Total Return Index. Performance results reflects the reinvestment of dividends, income and other earnings and are presented net of all foreign withholding taxes. Reclaimable withholding tax refunds are recognized when received. The benchmark is fully invested and its returns include the reinvestment of dividends, income and other earnings and are presented net of withholding taxes. Performance results are presented before management fees and custodial fees but after trading commissions.
[2] eVestment (evestment.com), information collected directly from investment management firms by eVestment with their agreement. Individual ranking provided by eVestment on the Canadian Fixed Income (core) Universe, gross returns, across 48 firms and 77 unique strategies as of August 31, 2026. More information can be provided upon request.
[3] Data is preliminary. The performance numbers are annualized and presented in Canadian dollars and refers to the Letko Brosseau Canadian Fixed Income Composite as of August 31, 2026. This Composite was created in January 1991 and is defined to include all discretionary Canadian dollar based fixed income mandates with asset mix targets for Canadian equities of less than 10%. The benchmark since inception is 5% FTSE Canada 91 Day T-Bill Total Return Index and 95% FTSE Canada Universe Bond Total Return Index. Performance results reflects the reinvestment of dividends, income and other earnings and are presented net of all foreign withholding taxes. Reclaimable withholding tax refunds are recognized when received. The benchmark is fully invested and its returns include the reinvestment of dividends, income and other earnings and are presented net of withholding taxes. Performance results are presented before management fees and custodial fees but after trading commissions.
Where the information contained in this presentation has been obtained or derived from third-party sources, the information is from sources believed to be reliable, but the firm has not independently verified such information. No representation or warranty is provided in relation to the accuracy, correctness, completeness or reliability of such information. Any opinions or estimates contained herein constitute our judgment as of this date and are subject to change without notice.
Past performance is not a guarantee of future returns. All investments pose the risk of loss and there is no guarantee that any of the benefits expressed herein will be achieved or realized.
The information provided herein does not constitute investment advice and it should not be relied on as such. It should not be considered a solicitation to buy or an offer to sell a security. It does not take into account any investor’s particular investment objectives, strategies, tax status or investment horizon. There is no representation or warranty as to the current accuracy of, nor liability for, decisions based on such information.
Certain information contained in this document constitutes “forward-looking statements,” which can be identified by the use of forward-looking terminology such as “may,” “will,” “should,” “expect,” “anticipate,” “target,” “project,” “estimate,” “intend,” “continue” or “believe,” or the negatives thereof or other variations thereon or comparable terminology. Forward-looking statements are inherently subject to, among other things, risks, uncertainties and assumptions regarding currencies, economic growth, current and expected conditions, and other factors that are believed to be appropriate in the circumstances which could cause actual events, results, performance or prospects to differ materially from those expressed in, or implied by, these forward-looking statements. Readers are cautioned not to place undue reliance on these forward-looking statements.
The MSCI information may only be used for your internal use, may not be reproduced or redisseminated in any form and may not be used as a basis for or a component of any financial instruments or products or indices. None of the MSCI information is intended to constitute investment advice or a recommendation to make (or refrain from making) any kind of investment decision and may not be relied on as such. Historical data and analysis should not be taken as an indication or guarantee of any future performance analysis, forecast or prediction. The MSCI information is provided on an “as is” basis and the user of this information assumes the entire risk of any use made of this information. MSCI, each of its affiliates and each other person involved in or related to compiling, computing or creating any MSCI information (collectively, the “MSCI parties”) expressly disclaims all warranties (including, without limitation, any warranties of originality, accuracy, completeness, timeliness, non-infringement, merchantability and fitness for a particular purpose) with respect to this information. Without limiting any of the foregoing, in no event shall any MSCI Party have any liability for any direct, indirect, special, incidental, punitive, consequential (including, without limitation, lost profits) or any other damages. (www.msci.com).
The S&P/TSX Index is a product of S&P Dow Jones Indices LLC or its affiliates (“SPDJI”) and TSX Inc., and has been licensed for use by Letko, Brosseau & Associates Inc. Standard & Poor’s® and S&P® are registered trademarks of Standard & Poor’s Financial Services LLC (“S&P”); Dow Jones® is a registered trademark of Dow Jones Trademark Holdings LLC (“Dow Jones”); and these trademarks have been licensed for use by SPDJI and sublicensed for certain purposes by Letko, Brosseau & Associates Inc. TSX® is a registered trademark of TSX Inc., and have been licensed for use by SPDJI and Letko, Brosseau & Associates Inc. Letko, Brosseau & Associates Inc.’s product is not sponsored, endorsed, sold or promoted by SPDJI, Dow Jones, S&P, their respective affiliates, or Bloomberg and none of such parties make any representation regarding the advisability of investing in such product(s) nor do they have any liability for any errors, omissions, or interruptions of the S&P/TSX Index.
Bloomberg Finance L.P. Used with permission of Bloomberg Finance L.P.
Concerned about your portfolio?
Subscribe to Letko Brosseau’s newsletter and other publications: