 Canada - FR
 U.S. - EN
Economic and Capital Markets Outlook
July 2026
- While the conflict in the Middle East adds a range of uncertainty to our economic growth forecast, our base case is for global real GDP to advance by 3.0% in 2026.
- Robust consumer spending and business investment underpin a constructive outlook for the U.S. economy. We forecast the U.S. to record around 2% real GDP growth in 2026.
- We expect activity in Canada will remain soft, but an accommodative mix of monetary and fiscal policy will help support growth. We anticipate Canadian real GDP growth near 1.0% in 2026.
- Activity is tepid in the Eurozone, though robust public spending should help to anchor regional growth in positive territory. We forecast Eurozone real GDP growth will settle around 0.5% in 2026.
- Momentum has waned in China after a strong start to the year. Policy support will ultimately determine whether China can achieve growth in line with the government’s target of 4.5-5.0% in 2026.
- Emerging market growth trends are increasingly divergent, but country-specific slowdowns are unlikely to derail aggregate activity. Consequently, the IMF projects emerging market real GDP growth of 3.9% in 2026.
- Equity valuations are lofty and earnings growth estimates remain elevated. We maintain that the best-suited approach for the current environment is an active strategy that emphasizes price sensitivity, diversification, and careful stock and bond selection.
Summary
The global economy has proven remarkably durable following a succession of tariff shocks in 2025 and the outbreak of the U.S./Israel-Iran war in 2026. Indeed, recent readings of economic activity point toward continued resilience this year, rather than a sharp deceleration. While the conflict in the Middle East complicates the picture for growth and inflation, repercussions vary considerably by country.
Tight oil supply has forced demand pullbacks in some areas of the developing world. From a global perspective, however, inventory drawdowns have provided a significant buffer to activity so far. So too have energy curtailment and efficiency efforts, as well as shifts to alternative fuel sources. These combined factors are playing a pivotal role in rebalancing global supply and demand for energy products.
Beyond energy, a suite of positive drivers continues to support the broader economic outlook. Surging AI investments are providing a tangible boost to GDP, though productivity benefits are still early and uneven. Strong demand for AI has also propelled global equity returns, which has helped sustain positive wealth effects – a pillar of consumer spending.
Meanwhile, fiscal policy remains accommodative in most major economies. On balance, government spending is likely to accelerate, and we expect a sizeable fiscal push to add close to one percentage point to developed market growth in the year ahead. On the monetary side, the lagged effects of last year’s extensive rate cut cycles should also help to shore up activity.
Recent accommodations between the U.S. and Iran may reopen the Strait of Hormuz and allow energy markets to begin to normalize over the next several months. Accordingly, we expect global growth momentum to persist and cannot rule out the possibility that activity may yet again surprise to the upside. Our base case outlook is for global real GDP to advance by around 3.0% in 2026.
Although the projected level of global activity is broadly stable, we believe a notable disconnect between economic fundamentals and investor expectations persists. Equity market valuations are at lofty levels and earnings growth estimates are elevated. This backdrop implies that negative changes in investor sentiment continue to pose the biggest risk to the economy and financial markets. We remain of the view that the best-suited approach for the current environment is an active strategy that emphasizes price sensitivity, diversification, and careful stock and bond selection.
U.S. economy continues to outperform
U.S. growth firmed at the start of the year. Real GDP expanded 0.5% quarter-on-quarter in Q1, compared to 0.1% in Q4 2025. Consumer spending rose by 0.1%, while business investment increased 1.9%. Elsewhere, government spending rebounded sharply to 1.1% from -1.4% in the previous quarter. Net exports fell 3.4%, due partly to robust domestic demand as imports increased 2.8%.
Household spending – the primary driver of the U.S. economy – is set to extend its resilient run. The U.S. labour market has regained traction after a period of slower job growth. In the first six months of the year, job gains averaged 92,000 per month, up from an average of 10,000 in 2025. Over the same period, the unemployment rate remained stable near a historically low 4.3%.
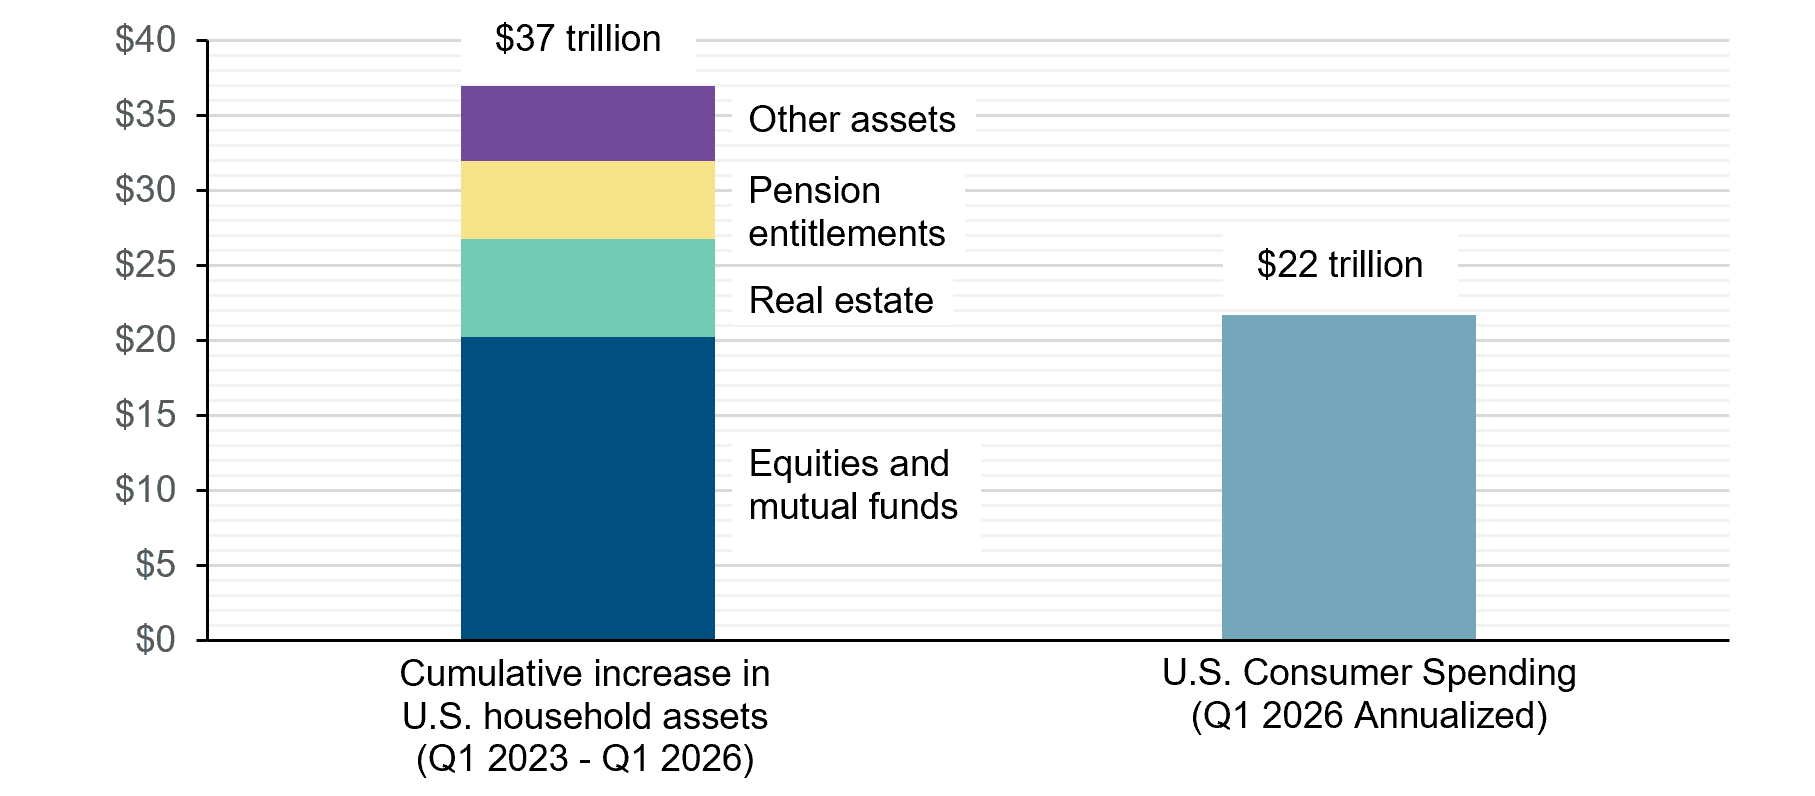
Tax refunds related to the One Big Beautiful Bill Act are providing a buffer to household budgets at a time of higher living costs. Indeed, total reimbursements are up by roughly $50 billion to date. We also note that U.S. private net worth climbed 7.9% in Q1 from a year ago, a positive contributor to consumer spending. Since 2023, household balance sheets have grown by $37 trillion, an amount greater than annual aggregate consumption (Chart 1).
Prospects for U.S. business investment are encouraging. Capital spending by AI hyperscalers is expected to remain a key support of domestic demand. Our estimates point to upwards of $5 trillion in AI-related investment from 2026–2031, with around $650 billion or 2% of U.S. GDP allocated for this year alone.
Weighing these factors against geopolitical tensions and trade uncertainty, we conclude the U.S. is on course for continued stable growth. We forecast real GDP will advance by around 2.0% in 2026, the highest growth rate among major developed economies.
Change in U.S. Household Assets vs. U.S. Consumer Spending (U.S.$ trillion)
Canada positioned to resume growth
In Canada, real GDP fell by a marginal 0.04% quarter-on-quarter in Q1 following a 0.2% contraction in the previous quarter. By definition, this marked the beginning of a technical recession. While we acknowledge momentum has waned at the headline level, we believe the recent pullback reflects unique, one-off factors rather than fundamental weakness.
Net trade was a significant drag on first quarter growth. Exports fell by 0.1% quarter-on-quarter while imports surged 2.9%, driven largely by a jump in gold purchases. Excluding trade, the economy would have expanded by 0.9% in the same period. On the domestic front, solid household spending (+0.4%) outweighed contractions in government expenditures (-0.6%) and business investment (-0.8%).
We believe conditions are in place to maintain aggregate consumption at healthy levels. With household net worth rising to a record C$18.9 trillion at the end of Q1 and equity markets continuing to advance, we expect higher-income households will continue to make a positive contribution to overall consumer spending. Meanwhile, real wage gains bolster the outlook across the wider consumer landscape. Average hourly earnings growth has hovered around 3-4% year-on-year to date, and on balance, tracked ahead of headline inflation (2-3%).
On the fiscal front, the decline in federal spending seen in Q1 was in large part due to lower defence spending relative to elevated Q4 2025 levels. Since then, a series of announcements, ranging from C$12 billion in GST-linked benefit enhancements and temporary fuel-excise tax relief to a $1.5 billion funding package for tariffed industries, confirm that policymakers remain committed to shoring up Canada’s economy.
In June, the Bank of Canada maintained its benchmark interest rate at 2.25%, a third consecutive hold at this accommodative level. Canada’s CPI has seen upward pressure due to higher energy prices, with May’s reading at 3.2%, compared with 2.3% in January. However, the core inflation rate (excluding food and energy) remains subdued at 1.7%. We expect Canada’s monetary backdrop to remain moderately stimulative.
Trade uncertainty around CUSMA renegotiations complicates Canada’s outlook. Nonetheless, we believe the economy is on track for another year of subdued, but positive, growth. Activity is underpinned by resilient consumer spending and supportive fiscal and monetary policies. We forecast Canadian real GDP growth to approach 1.0% in 2026.
Challenging outlook for the Eurozone
Eurozone real GDP contracted by 0.2% in Q1 from the previous quarter. Spain continued to lead growth among the region’s major economies, recording a quarter-on-quarter expansion of 0.6%. Germany and Italy each recorded 0.3% growth in the same period, while output in France declined by 0.1%. Looking ahead, energy pressures have the potential to exacerbate weaknesses already present across the region.
Intensifying inflation and a deteriorating growth outlook present the European Central Bank (ECB) with a difficult trade-off. Recent actions suggest policymakers are more inclined to tolerate weaker activity rather than allowing inflationary pressures to become entrenched. Consistent with this objective, the ECB raised its benchmark interest rate by 25 basis points to 2.25% in June.
Going forward, tighter monetary policy is likely to weigh on Eurozone consumer spending as households are already contending with softer labour market conditions, moderating wage growth and higher inflation. Considered alongside tighter financial conditions, these factors point to a gradual loss of momentum in domestic demand in the coming quarters.
Encouragingly, the Eurozone economy possesses a notable offset to current challenges. German fiscal stimulus in the form of higher infrastructure and defence-related spending is equivalent to approximately 1% of GDP this year. On balance, around half of Eurozone countries project higher spending and wider budget deficits, helping to anchor regional growth in positive territory.
The Eurozone economy is positioned for a moderate slowdown given its external energy dependence and inflation predicament. We anticipate real GDP growth will settle near 0.5% in 2026.
Domestic pressures build in China
China’s real GDP grew 5.0% year-on-year in the first quarter. While exports and industrial production have continued to grow robustly since then, large swaths of the domestic economy remain subdued.
Total exports climbed 19.4% year-on-year in May. The nominal value of China’s exports has already surpassed $1.7 trillion in the first five months of the year, and the external sector is well on track to make another sizeable contribution to aggregate activity. Indeed, given strong links between China’s trade sector and industrial complex, manufacturing has performed well to date. Industrial production advanced by 4.5% on an annual basis in May.
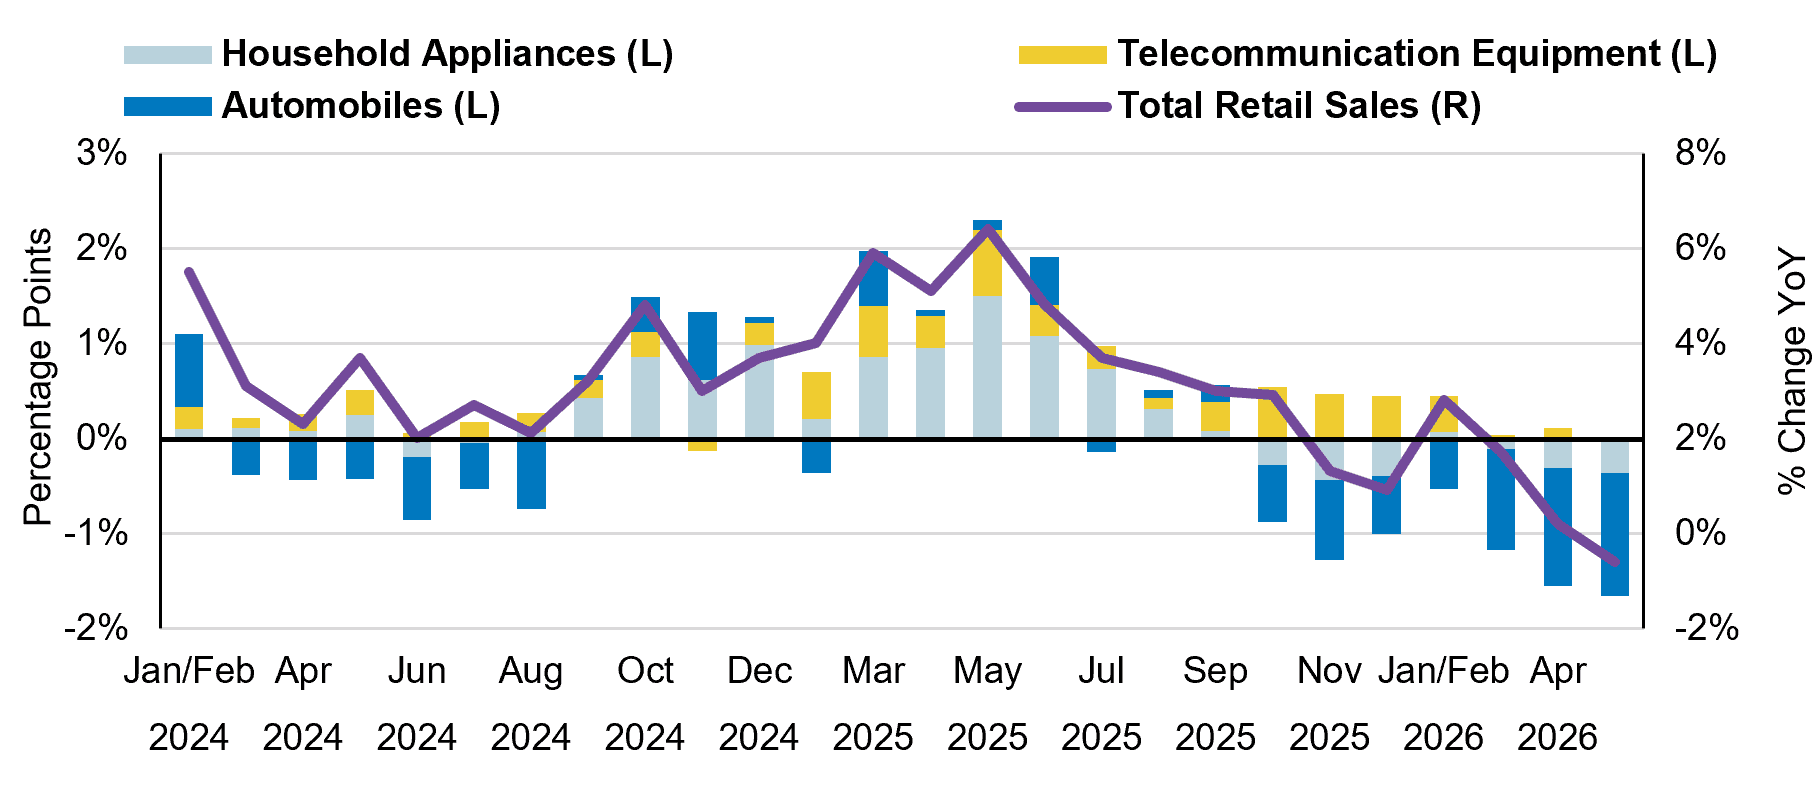
In contrast, consumer spending has been sluggish. Retail sales grew by just 1.4% year-on-year in the first 5 months of the year. The weakness of household demand at least partly reflects base effects linked to last year’s RMB 300 billion consumer subsidy scheme. Spending on autos, home appliances and telecommunication equipment – all focal points of 2025 subsidies – has retrenched in annual terms, pulling down retail sales in aggregate (Chart 2). Meanwhile, government assistance targeted at service sector spending has had a muted effect to date.
Turning to investment, China’s housing market continues to weigh on the broader economy. Total fixed asset investment fell by 4.1% year-on-year in the January-May period amid a pronounced 16.2% contraction in real estate investment. Infrastructure spending (+0.6%) and manufacturing investment
(-0.4%) cooled significantly in April and May, after a stimulus-led bounce in the first quarter. Recent trends suggest policy implementation is likely to accelerate in order to stabilize investment; a government pledge of RMB 7 trillion (≈3.4% of GDP) in infrastructure spending is an encouraging signal.
Looking ahead, policy supports will ultimately decide if domestic demand picks up, and in turn, whether China can achieve growth in line with the government’s target of 4.5-5.0% in 2026.
China: Contribution from Trade-In Goods to Retail Sales Growth
Uneven prospects in emerging markets
In India, real GDP advanced by 7.8% year-on-year in Q1. Oil price pressures are a clear headwind but given India’s high baseline growth before the energy price shock, only a mild deceleration is anticipated. The IMF forecasts India’s real GDP to advance by 6.5% in 2026.
Mexico grew only 0.2% in real annual terms in the first quarter. U.S. tariffs and mounting energy costs present obstacles to growth. However, looser monetary policy, historically low unemployment and healthy real wage gains should anchor activity in positive territory. Overall, Mexico is expected to expand by 1.6% in 2026 per IMF estimates. Elsewhere in Latin America, growth prospects have improved in Brazil, a function of its status as an energy exporter. The IMF projects real GDP to advance by 1.9% in 2026, an upgrade of +0.3% relative to its January forecast.
In the Philippines, activity slowed to a multi-year low in Q1 as GDP growth moderated to 2.8% in real annual terms. With the central bank raising rates in response to surging inflation, real growth will likely undershoot the government’s 5-6% target range this year. Similarly, in Indonesia, the central bank has been forced to walk back some of its recent interest rate cuts as it seeks to support its depreciating currency and contain inflation. The IMF’s current real GDP forecast of 5% could soon see a downward revision.
Emerging market growth trends are increasingly divergent. While oil and gas exporters stand to benefit from stronger balance of payments and higher fiscal revenues, the reverse holds true for net energy importers, particularly those in Southeast Asia. Nonetheless, adverse conditions are limited in a wider sense. ASEAN economies account for just 8.6% of emerging market real GDP, and country-specific slowdowns are unlikely to derail aggregate growth. Consequently, the IMF projects emerging market real GDP growth of 3.9% in 2026.
Surging AI demand pushes markets to record highs
Global equity markets advanced to record highs in Q2. On a year-to-date basis, the S&P 500 gained 14.1% (total return in Canadian dollars), S&P/TSX was up 11.2% while MSCI ACWI and MSCI Emerging Markets rose 15.1% and 28.2%, respectively.
The U.S.-Iran ceasefire deal explains some of the strong performance of equities in the quarter, though the majority of the increase is owed to the performance of AI-related companies. Indeed, the ten largest constituents within the S&P 500 – eight of which are tech-related – have accounted for the vast majority of index returns to date. Collectively, they account for a remarkable 41% of the index’s market capitalization. These companies trade at a weighted average forward P/E of 36, highlighting a combination of lofty valuations and narrow index breadth – a feature we view as a fundamental vulnerability to a reversal in sentiment.
Similar risks have developed in other markets as well. Despite containing 1,000 constituents across 24 developing economies, the MSCI Emerging Markets Index owes its outsized year-to-date returns to only a narrow group of Asian chipmakers. Indeed, Taiwan Semiconductor Manufacturing Company (TSMC), Samsung Electronics, and SK Hynix accounted for over 80% of the index’s gains from January to June. This trio now commands roughly a 30% index weight, while Taiwan and South Korea make up nearly half of the MSCI EM’s total market capitalization. While these companies and countries occupy a crucial position in the booming AI infrastructure buildout currently underway, it is important to remain mindful of the extraordinary degree of index concentration and growing prevalence of AI trends across asset classes.
In addition, we continue to view excessively optimistic earnings estimates as another potential source of volatility. Consensus forecasts call for earnings per share for the MSCI All Country World Index (ACWI) to increase 17.4% year-on-year in 2026 (Table 1). We believe this target may prove difficult to achieve even if economic activity remains stable and geopolitical uncertainty dissipates. Should realized earnings fall short of investors’ high expectations, or forward guidance disappoint, concerns about the longevity of the AI spending boom and the equity market rally could re-emerge.
Consensus Outlook for Global Equity Market Earnings
Year-on-year Growth of Index Earnings per Share
| 2025 Realized | 2026 Forecast | 2027 Forecast | 2028 Forecast | |
| MSCI ACWI | 12.0% | 17.4% | 15.8% | 11.3% |
| MSCI World | 11.8% | 12.8% | 14.2% | 11.2% |
| MSCI USA | 13.4% | 15.5% | 16.7% | 12.9% |
| MSCI Canada | 10.5% | 17.9% | 6.1% | 1.5% |
| MSCI Europe | -1.7% | 9.0% | 8.6% | 9.4% |
| MSCI Pacific ex Japan | -0.1% | 15.7% | 3.7% | 4.7% |
| MSCI Japan | 4.7% | 6.5% | 14.5% | 7.3% |
| MSCI EM | 11.9% | 44.1% | 23.5% | 12.4% |
| MSCI EM EMEA | 16.7% | 18.2% | 11.0% | 7.9% |
| MSCI EM Latin America | 20.1% | 23.4% | 5.9% | 7.3% |
| MSCI EM Asia | 10.0% | 50.8% | 26.9% | 13.4% |
Periods such as these reinforce the importance of maintaining a disciplined risk management framework and principled investment approach based on price sensitivity, diversification and careful stock selection. On balance, we believe our equity strategies remain relatively well valued. LetkoBrosseau’s Global Equity pooled fund trades at 14.2 times forward earnings (vs. 19.1 times for the MSCI ACWI Index) and the Emerging Markets pooled fund trades at 11.6 times (vs. 12.7 times for the MSCI EM Index). Furthermore, we believe our holdings exhibit robust medium-to-long-term earnings growth potential. These characteristics give us confidence to remain invested even as market dynamics suggest excesses may be present.
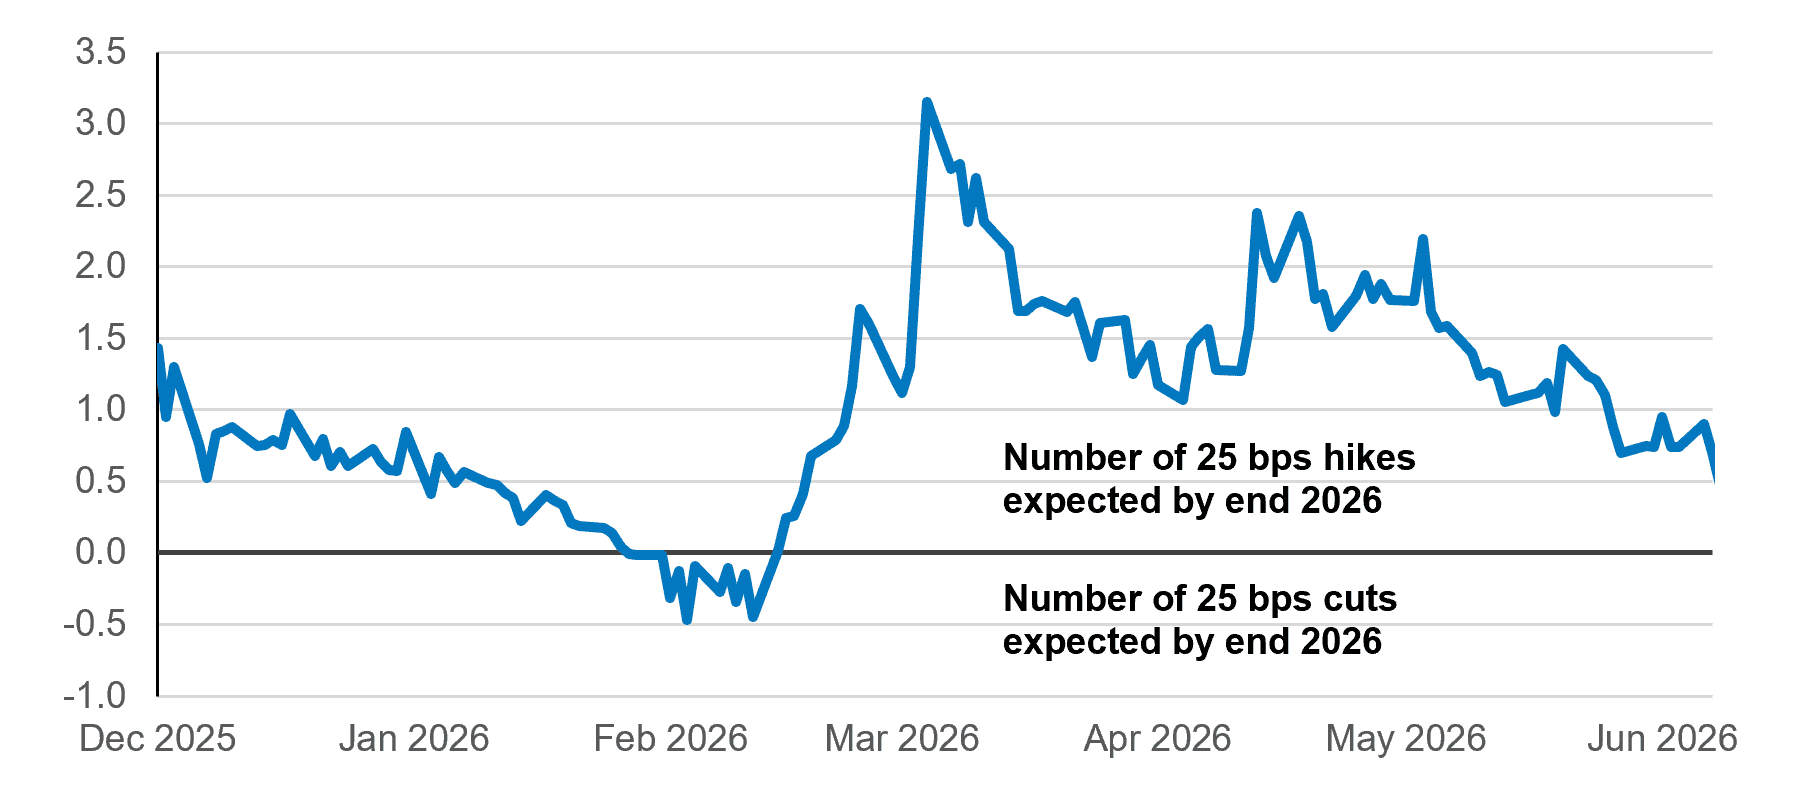
Turning to fixed income, recent months presented several opportunities to redeploy cash into bonds. On select occasions, we made purchases consistent with our emphasis on credit quality when yields became pressured upward by excessive fears of inflation and soaring policy rate expectations. In March, for example, markets were expecting more than three rate hikes from the Bank of Canada over the coming year — expectations we judged overstated relative to our economic outlook. Since then, expectations have come down substantially and, at present, markets are no longer pricing in even one full 25 basis point rate hike by year end (Chart 3).
As for portfolio duration positioning, our strategy remains unchanged. We estimate the fair value of 10- and 30-year Canadian government bonds to be around 4-4.5%, compared to current yields of 3.38% and 3.77% respectively. This suggests longer-dated Canadian bonds are still expensive. As a result, we continue to maintain a lower-than-benchmark duration. Overall, we do not advocate any major changes in asset allocation at this juncture.
Expected number of Bank of Canada 25 basis point hikes/cuts by the end of 2026
The information and opinions expressed herein are provided for informational purposes only, are subject to change and are not intended to provide, and should not be relied upon for, accounting, legal or tax advice or investment recommendations. Any companies mentioned herein are for illustrative purposes only and are not considered to be a recommendation to buy or sell. It should not be assumed that an investment in these companies was or would be profitable. Unless otherwise indicated, information included herein is presented as of the dates indicated. While the information presented herein is believed to be accurate at the time it is prepared, Letko, Brosseau & Associates Inc. cannot give any assurance that it is accurate, complete and current at all times.
Where the information contained in this presentation has been obtained or derived from third-party sources, the information is either from recognized financial and statistical reporting services or similar sources believed to be reliable, but the firm has not independently verified such information. No representation or warranty is provided in relation to the accuracy, correctness, completeness or reliability of such information. Any opinions or estimates contained herein constitute our judgment as of this date and are subject to change without notice.
Past performance is not a guarantee of future returns. All investments pose the risk of loss and there is no guarantee that any of the benefits expressed herein will be achieved or realized.
The information provided herein does not constitute investment advice and it should not be relied on as such. It should not be considered a solicitation to buy or an offer to sell a security. It does not take into account any investor’s particular investment objectives, strategies, tax status or investment horizon. There is no representation or warranty as to the current accuracy of, nor liability for, decisions based on such information.
Certain information contained in this document constitutes “forward-looking statements,” which can be identified by the use of forward-looking terminology such as “may,” “will,” “should,” “expect,” “anticipate,” “target,” “project,” “estimate,” “intend,” “continue” or “believe,” or the negatives thereof or other variations thereon or comparable terminology. Forward-looking statements are inherently subject to, among other things, risks, uncertainties and assumptions regarding currencies, economic growth, current and expected conditions, and other factors that are believed to be appropriate in the circumstances which could cause actual events, results, performance or prospects to differ materially from those expressed in, or implied by, these forward-looking statements. Readers are cautioned not to place undue reliance on these forward-looking statements.
The MSCI information may only be used for your internal use, may not be reproduced or redisseminated in any form and may not be used as a basis for or a component of any financial instruments or products or indices. None of the MSCI information is intended to constitute investment advice or a recommendation to make (or refrain from making) any kind of investment decision and may not be relied on as such. Historical data and analysis should not be taken as an indication or guarantee of any future performance analysis, forecast or prediction. The MSCI information is provided on an “as is” basis and the user of this information assumes the entire risk of any use made of this information. MSCI, each of its affiliates and each other person involved in or related to compiling, computing or creating any MSCI information (collectively, the “MSCI parties”) expressly disclaims all warranties (including, without limitation, any warranties of originality, accuracy, completeness, timeliness, non-infringement, merchantability and fitness for a particular purpose) with respect to this information. Without limiting any of the foregoing, in no event shall any MSCI Party have any liability for any direct, indirect, special, incidental, punitive, consequential (including, without limitation, lost profits) or any other damages. (www.msci.com).
The S&P/TSX Index is a product of S&P Dow Jones Indices LLC or its affiliates (“SPDJI”) and TSX Inc., and has been licensed for use by Letko, Brosseau & Associates Inc. Standard & Poor’s® and S&P® are registered trademarks of Standard & Poor’s Financial Services LLC (“S&P”); Dow Jones® is a registered trademark of Dow Jones Trademark Holdings LLC (“Dow Jones”); and these trademarks have been licensed for use by SPDJI and sublicensed for certain purposes by Letko, Brosseau & Associates Inc. TSX® is a registered trademark of TSX Inc., and have been licensed for use by SPDJI and Letko, Brosseau & Associates Inc. Letko, Brosseau & Associates Inc.’s product is not sponsored, endorsed, sold or promoted by SPDJI, Dow Jones, S&P, their respective affiliates, or Bloomberg and none of such parties make any representation regarding the advisability of investing in such product(s) nor do they have any liability for any errors, omissions, or interruptions of the S&P/TSX Index.
Bloomberg Finance L.P. Used with permission of Bloomberg Finance L.P.
Concerned about your portfolio?
Subscribe to Letko Brosseau’s newsletter and other publications: