 Canada - FR
 U.S. - EN
Portfolio Update
November 8, 2021
Global equity markets have continued their ascent, driven by favourable business conditions and the resulting strong increase in earnings. Year-to-date, the total return for the S&P 500 Index was 20.7% in Canadian dollars, the S&P/TSX was ahead 23.4% and the MSCI World Index rose 16.2%. Our equity strategies have outperformed their benchmarks over the same period and are well positioned for the next phase of the recovery. Furthermore, our balanced strategy has benefited from a short duration stance in bonds and an allocation decision to favour equities. Fixed income instruments, as well as expensively-valued stocks, remain vulnerable to inflation pressures. Our portfolios have been structured to mitigate these risks.
Double-digit earnings growth projected for our portfolio companies
Companies reported strong profits for the third quarter, on the back of a robust recovery from the pandemic. For example, operating earnings for the S&P 500 grew by an estimated 53% year-on-year. Notwithstanding this remarkable performance, we still see upside potential, particularly for our portfolio companies. Our equity strategies are projected to grow earnings faster than benchmark indices over the next two years and yet continue to reflect very attractive valuations (Table 1). Indeed, consensus estimates indicate that sales and profits for our Canadian equity strategy should expand at almost twice the rate of the S&P/TSX and the portfolio trades at around 10x earnings, a 33% discount to the market. Our non-Canadian equity portfolio trades at a similar discount and is expected to experience even greater earnings growth, exceeding 20% over the two-year period.
Projected key metrics of companies in LetkoBrosseau equity portfolios vs. benchmark indexes
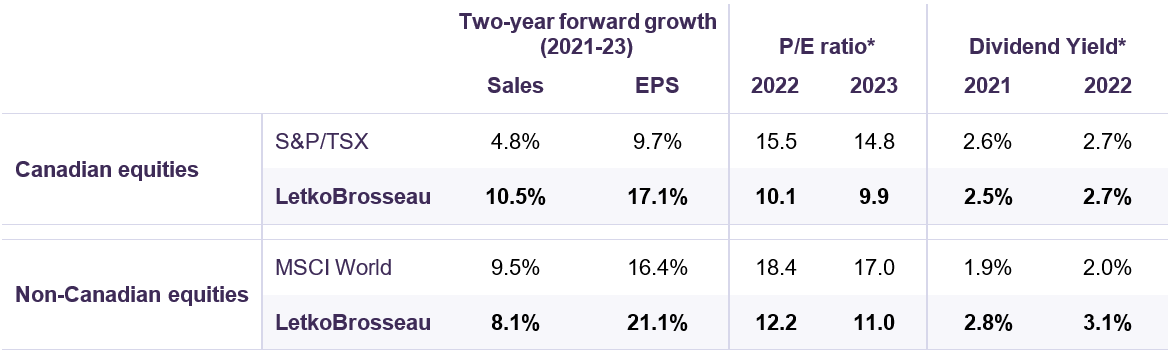
*Based on equity prices as of September 30, 2021.
Sources: FactSet (www.factset.com) financial data and analytics consensus estimates and LBA calculations, Letko Brosseau Canadian Equity Fund, Letko Brosseau International Equity Fund
How have we factored the risk of inflation into our portfolio strategy?
The U.S. Core Consumer Price Index, a measure of inflation that strips out the volatile components of energy and food, increased at an annual rate of 4.0% in September or twice the level targeted by the Federal Reserve. As we explain in our latest Economic and Capital Markets Outlook report, we believe that the recent surge in inflation is largely attributable to disruptions in global supply chains and items specifically impacted by the pandemic, such as hotels and airfares. These factors are temporary and will eventually abate.
While inflation may well trend above the last decade’s average of 1.8% for some time, this is unlikely to derail global growth. What could damage the recovery is persistently rising price pressures which feed into ever rising inflation rates. There are concerns that structural factors, such as an accelerated pace of baby boomer retirement, together with a cyclical shortage of service sector workers, will stimulate strong wage growth and cause inflation to become entrenched. We believe that as borders reopen to immigration and pandemic wage relief measures are discontinued, this source of price pressure will temper. At this juncture, we consider the risk of such runaway inflation to be low.
Fundamentally, a little more inflation in the pipeline is usually a beneficial environment for value-oriented stocks. The chart below shows that there is a positive relationship between inflation and an outperformance of price-sensitive portfolio strategies. Using historical data, we examined the performance of U.S. value stocks against growth stocks during the last ninety years. Value stocks outperformed on an annualized basis over the decade in all periods except for the 1930s (depression/deflation), the 1990s (tech bubble) and the 2010s (ultra-low interest rates/”quantitative easing”). Also, value outperformed growth in all but one of the seven decades where the annualized inflation rate was above 2%. This is likely because these environments are usually accompanied by higher interest rates which exert a disproportionately negative impact on more expensively-valued growth stocks.
Relative Performance of U.S. Value and Growth Stocks vs. Inflation
(1930-2019)
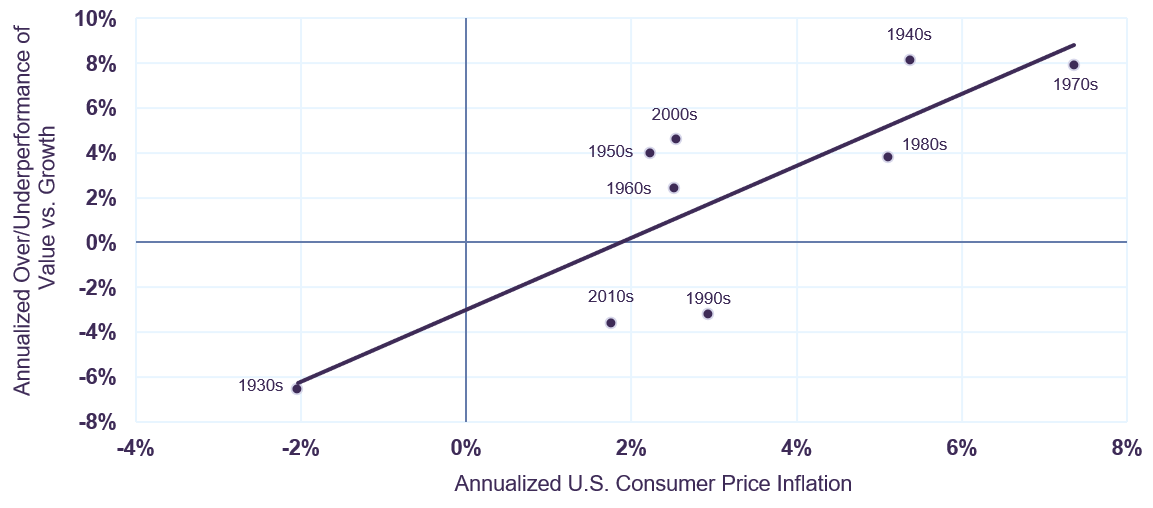
Sources: U.S. Bureau of Labor Statistics. All data references to growth and value are based on the Fama/French Data Library of historical returns of U.S. large cap companies in the NYSE, AMEX, and NASDAQ: https://mba.tuck.dartmouth.edu/pages/faculty/ken.french/data_library.html. Data include Letko Brosseau calculations.
Our portfolios tend to trade at lower multiples to earnings, cash flows, book value and sales. Not only does empirical evidence suggest that such an approach does well over time and particularly outperforms during inflationary environments, our portfolios have been constructed to tolerate higher inflation. From an asset allocation standpoint, we have tilted balanced portfolios away from fixed income instruments towards equities. Our bond strategy mitigates rising price pressures and the potential for higher interest rates by maintaining an average duration below two years. Meanwhile, our equity portfolios are exposed to sectors that offer a natural hedge against inflation (commodities) and tend to do well in rising rate environments (financials). We are limiting exposure to fixed income-like sectors such as utilities and real estate. We are also avoiding high valuation stocks as these are vulnerable to rising interest rates.
We continue to see a long runway of growth ahead and believe our portfolios are set to capture both cyclical and secular trends, while still offering reasonable value.
All dollar references in the text are U.S. dollars unless otherwise indicated.
The information and opinions expressed herein are provided for informational purposes only, are subject to change and are not intended to provide, and should not be relied upon for, accounting, legal or tax advice or investment recommendations. Unless otherwise indicated, information included herein is presented as of the dates indicated. While the information presented herein is believed to be accurate at the time it is prepared, Letko, Brosseau & Associates Inc. cannot give any assurance that it is accurate, complete and current at all times.
Where the information contained in this presentation has been obtained or derived from third-party sources, the information is from sources believed to be reliable, but the firm has not independently verified such information. No representation or warranty is provided in relation to the accuracy, correctness, completeness or reliability of such information. Any opinions or estimates contained herein constitute our judgment as of this date and are subject to change without notice.
Past performance is not a guarantee of future returns. All investments pose the risk of loss and there is no guarantee that any of the benefits expressed herein will be achieved or realized.
The information provided herein does not constitute investment advice and it should not be relied on as such. It should not be considered a solicitation to buy or an offer to sell a security. It does not take into account any investor’s particular investment objectives, strategies, tax status or investment horizon. There is no representation or warranty as to the current accuracy of, nor liability for, decisions based on such information.
This presentation may contain certain forward-looking statements which reflect our current expectations or forecasts of future events concerning the economy, market changes and trends. Forward-looking statements are inherently subject to, among other things, risks, uncertainties and assumptions regarding currencies, economic growth, current and expected conditions, and other factors that are believed to be appropriate in the circumstances which could cause actual events, results, performance or prospects to differ materially from those expressed in, or implied by, these forward-looking statements. Readers are cautioned not to place undue reliance on these forward-looking statements.
The MSCI information may only be used for your internal use, may not be reproduced or redisseminated in any form and may not be used as a basis for or a component of any financial instruments or products or indices. None of the MSCI information is intended to constitute investment advice or a recommendation to make (or refrain from making) any kind of investment decision and may not be relied on as such. Historical data and analysis should not be taken as an indication or guarantee of any future performance analysis, forecast or prediction. The MSCI information is provided on an “as is” basis and the user of this information assumes the entire risk of any use made of this information. MSCI, each of its affiliates and each other person involved in or related to compiling, computing or creating any MSCI information (collectively, the “MSCI parties”) expressly disclaims all warranties (including, without limitation, any warranties of originality, accuracy, completeness, timeliness, non-infringement, merchantability and fitness for a particular purpose) with respect to this information. Without limiting any of the foregoing, in no event shall any MSCI Party have any liability for any direct, indirect, special, incidental, punitive, consequential (including, without limitation, lost profits) or any other damages. (www.msci.com).
Concerned about your portfolio?
Subscribe to Letko Brosseau’s newsletter and other publications: