 Canada - FR
 U.S. - EN
- We anticipate another year of positive but below-trend growth for the global economy. Our base case is for global real GDP to advance by 3.2% in 2025.
- Renewed trade tensions present a key risk to our outlook. The impact of tariffs will vary by country and depend on the scale, timing and implementation, all of which remain to be seen.
- An accommodative monetary and fiscal policy mix should support the U.S. economy as it navigates the final stages of its post-pandemic adjustment. We forecast U.S. real GDP growth to moderate to between 1.0-2.0% in 2025.
- Accumulated savings should help Canadian households weather a period of higher unemployment. We forecast Canadian real GDP growth in the 1.0-2.0% range in 2025.
- The Eurozone economy has staged a mild recovery from a period of stagnation during 2023, but prospects remain weak. We anticipate Eurozone real GDP growth of 0.5-1.5% in 2025.
- China’s outlook largely depends on the scale of additional stimulus measures and the evolution of the trade landscape. The Chinese economy is forecast to slow to 4.5% in real annual terms in 2025 per IMF estimates. In aggregate, the IMF forecasts emerging markets’ real GDP growth to remain stable at 4.2% in the year ahead.
- Equity markets closed the year with double-digit gains. While we remain mindful of the risks posed by signs of euphoria in U.S. equities and increased U.S. trade protectionism, we do not advocate for any material shifts in asset allocation. We are reducing exposure to fully valued companies while maintaining a moderate tilt towards equities over cash and bonds.
Summary
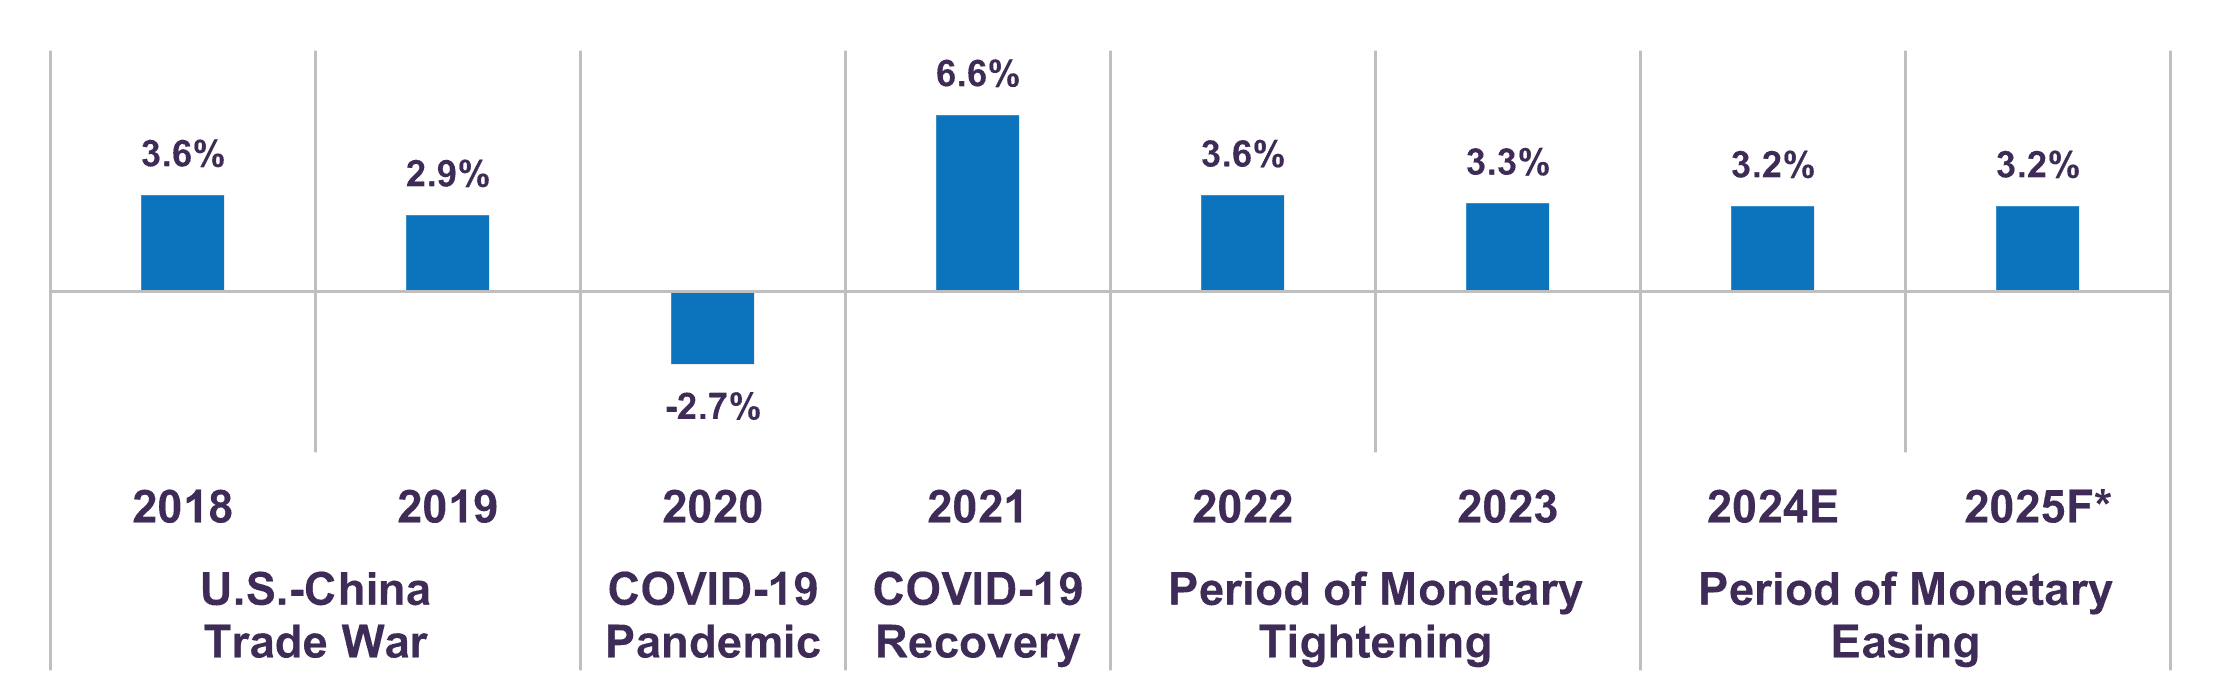
The global economy’s resilience has confounded many forecasters. When inflation surged to multi-decade highs post-pandemic, the aggressive policy responses of central banks around the world led many to believe a recession in 2023 was inevitable. Instead, a downturn never materialized, and the global economy continued to motor ahead. Economic growth in 2024 appears to have exceeded consensus expectations once again. The IMF estimates global real GDP rose 3.2% in 2024, a 0.3% upgrade from their October 2023 forecast and well above recession levels.
Looking ahead, our base case forecast is another year of positive but below-trend growth, with world GDP advancing 3.2% in 2025, unchanged from 2024 (Chart 1). We acknowledge that the Trump administration’s plans to levy new tariffs introduce a risk to this forecast. Emerging markets, in particular, may encounter a more challenging trade environment. However, the impact of a potential trade war will vary considerably by country and will depend on the scale, timing, and implementation of tariffs, all of which remain to be seen.
Global Real GDP Growth (% Y/Y change)
On balance, we do not foresee an unduly pessimistic scenario unfolding for the global economy. We expect growth to remain stable for both advanced economies and emerging markets. In our assessment, however, the U.S. equity market necessitates a degree of caution from investors. A combination of elevated valuations, optimistic earnings expectations, and high degree of index concentration point to growing U.S. market euphoria. This suggests that changes in sentiment, rather than fundamentals, pose the main risk to returns in the year ahead. We believe an active approach that emphasizes price sensitivity and careful stock and bond selection will be essential to navigating this heightened risk environment.
The U.S. is on track for another year of steady growth
The U.S. economy saw a robust third quarter. Real GDP expanded 0.8% quarter-on-quarter and 2.7% against a year ago. Household spending, the economy’s main driver, grew 0.9% quarter-on-quarter, reflecting strong demand for both goods (+1.4%) and services (+0.7%). Much of the economy’s resilience can be credited to solid consumer spending, a theme that will likely continue in 2025.
After several years of above-trend hiring, labour market fundamentals are returning to normal. In the last six months, job gains averaged 143,000 per month, down from an average of 205,000 the prior year. Similarly, the ratio of job openings to unemployed people – a measure of labour demand and supply – stands at 1:1 presently. This is in line with its long-term average and well below the 2022 demand/supply peak of 2:1.
The labour market is cooling without a material uptick in joblessness. November’s unemployment rate was 4.2%, near a historical low. Businesses are neither aggressively increasing headcount nor cutting their workforce on a large scale. These favourable dynamics have allowed real wage growth to stabilize at lower, but still healthy, levels. Average hourly earnings increased by 4.0% year-on-year in November, tracking ahead of inflation (2.7%).
On balance, we believe U.S. labour market conditions will continue to loosen in the year ahead, tempering wage growth and leading to moderately higher unemployment. This suggests that, an increasing number of less-affluent households will have to pare back spending, given a greater reliance on employment income and an absence of savings. However, as noted in our October Economic and Capital Markets Outlook, prospects for consumer spending vary considerably across households. Middle- and higher-income Americans have enjoyed significant wealth gains in recent years and possess a substantial amount of reserve spending power. With household net worth rising to a record level of $169 trillion, we expect spending by more affluent consumers to offset the growing drag from lower-income consumers in the coming months.
Private spending will remain the main driver of the U.S. economy in 2025, but fiscal policy may also make a positive contribution to growth. Trump’s 2017 economic agenda enacted tax cuts and deregulation, leading to a boost in business confidence and economic activity. A similar policy approach appears to be in the cards for Trump’s second term in office, with larger budget deficits in store. While the longer run impacts of the incoming administration’s fiscal policies may be less clear, on the monetary front, the U.S. Federal Reserve’s recent shift to a more supportive stance is set to provide a tailwind to activity toward the end of the year and into 2026.
An accommodative policy mix should help shore up growth as the U.S. economy navigates the final stages of its post-pandemic adjustment. Consequently, we forecast U.S. real GDP growth to moderate to between 1.0-2.0% in 2025, down from around 2.8% in 2024.
More BoC rate cuts ahead as Canadian economy cools
In Canada, real GDP advanced 1.5% year-on-year in the third quarter. However, sequential activity weakened. Real GDP rose 0.3% quarter-on-quarter in Q3, compared to a 0.5% rate of growth recorded over the first half of the year. Notable expansions in household spending (+0.9%) and government expenditures (+1.2%) were partially offset by declines in business investment (-0.9%) and residential construction (-0.1%). Despite a competitive Canadian dollar and resilient activity in the U.S., exports also detracted from growth in the third quarter, falling 0.3% against the previous three-month period.
The unemployment rate has steadily edged up from a near-record low of 5.0% in early 2023 to 6.8% in November, a post-pandemic high. The rise is primarily due to robust labour force growth outpacing job creation, rather than being driven higher by job losses. Over the past two years, the gradual and moderate adjustment in the labour market has helped maintain household income growth at healthy levels. Indeed, average hourly earnings rose 4.1% year-on-year in November.
Solid income growth has kept household balance sheets strong. The personal savings rate rose to 7.1% in the third quarter from 6.2% in Q2, a sign that Canadians have continued to stockpile savings. Accumulated savings currently total C$370 billion (12% of GDP) and should maintain aggregate consumption in positive territory, even if the job market continues to soften in 2025.
On the fiscal front, Canada’s finances are not as dire as have been portrayed. The 2024 budget deficit of C$61 billion is around 2% of domestic GDP, well below that of the U.S. (currently at 7.6% of GDP), France (6.0% of GDP) and the U.K. (4.3% of GDP). Canada’s overall debt picture is also on much more solid footing than most major developed economies. On balance, we do not expect the recent overshooting of budget targets to be a material risk to the country’s economic prospects.
We believe the Canadian economy is on track for another year of subdued, but positive, growth. Rising labour market slack and continued progress on inflation reinforce the likelihood that the Bank of Canada will continue to cut rates in the months ahead. Currently, fixed income markets have priced in a further 62 basis points of policy rate cuts by December 2025 (Table 1). This should help bring stability to interest-rate sensitive sectors, such as housing, later this year.
Notwithstanding the potential negative effects of U.S. tariffs on the Canadian economy, a topic we explore in more detail below, we forecast Canadian real GDP growth in the 1.0-2.0% range in 2025.
Bank of Canada Implied Rate Cuts Current Policy Rate: 3.25%
| Meeting Date |
Implied Policy Rate* |
Change in rate from current level (bps) |
| 2025-01-29 | 3.10% | -15 |
| 2025-03-12 | 2.97% | -28 |
| 2025-04-16 | 2.85% | -40 |
| 2025-06-04 | 2.75% | -50 |
| 2025-07-30 | 2.69% | -56 |
| 2025-09-17 | 2.64% | -61 |
| 2025-10-29 | 2.63% | -62 |
| 2025-12-10 | 2.63% | -62 |
Eurozone economy advances but activity remains subdued
The Eurozone economy has staged a mild recovery from a period of stagnation during 2023. In the third quarter of 2024, real GDP grew 0.4% from the prior quarter and 0.9% in annual terms. While these figures marked the Eurozone’s best performance in several quarters, regional disparities and weak domestic demand present ongoing challenges to growth.
In Spain, real GDP growth remained elevated in Q3 (+0.8% quarter-on-quarter) but continued to be largely driven by strong external demand. Elsewhere, Germany only narrowly avoided recession in the same period as real GDP advanced 0.1% quarter-on-quarter, a slight rebound from a 0.3% contraction in the previous three months. Real GDP grew by a solid 0.4% quarter-on-quarter in France, yet economic prospects have since been dampened by a recent bout of political instability.
More timely metrics point to weaker domestic demand and poor business investment across the Eurozone in the final months of 2024. In December, the HCOB Eurozone Composite PMI indicated a second consecutive month of contraction in private business activity. Notably, the reading also extended a more than two-year decline in manufacturing sector output.
While the disinflation process has slowed – core inflation has been 2.7% since September – the tepid state of the Eurozone economy suggests the ECB will continue transitioning toward a more accommodative stance. In our view, activity in the Eurozone will remain sluggish, but easier financial conditions increase the likelihood that the region is heading toward a soft landing. We forecast Eurozone’s real GDP to advance between 0.5-1.5% in 2025.
Stimulus and trade environment critical to China’s outlook
The Chinese economy advanced 4.6% year-on-year in the third quarter. Growth continued to trend lower amid persistent headwinds from a struggling real estate sector and sluggish domestic demand. While recent stimulus measures did not bring about the broad-based acceleration many had hoped for, some pockets of the real economy improved toward year-end.
During the first two months of Q4, retail sales grew by 3.9% year-on-year, a notable uptick from the 2.7% growth rate recorded over Q3. Investments in manufacturing and infrastructure – important offsets to declining real estate investment – both accelerated in the same period. Elsewhere, manufacturing sector output growth improved to a six-month high in November.
In contrast, China’s housing market showed little sign of improvement in the final months of the year. Real estate investment fell 10.4% year-on-year in November, confirming 2024 will mark a third consecutive year of contraction. We expect housing will weigh on the broader economy for some time, given the structural nature of China’s property market troubles.
China’s external environment risks becoming an additional headwind to growth given the prospects for more punitive U.S. tariffs, which we cover in greater detail below. These dynamics reinforce our view that further monetary and fiscal easing is likely in the year ahead. Indeed, the series of support measures announced since late-September, ranging from the central bank’s interest rate cuts to a $1.4 trillion local government debt package, confirm that, policymakers remain committed to stabilizing China’s economy.
The IMF forecasts China’s real GDP to advance by 4.5% in 2025, but much will ultimately depend on the scale of additional stimulus efforts and the evolution of the trade landscape.
Mixed prospects for other emerging market economies
In India, real GDP grew 5.4% year-on-year in Q3. Growth was significantly lower than the 6.7% rate of expansion recorded in the previous quarter. The economy’s deceleration was largely owed to weaker industrial sector output (+3.9%). Activity in the services sector – which has a stronger link to domestic demand – remained robust, rising 7.1% in the same period. The Indian economy is projected to grow by 6.5% in real annual terms in 2025, per IMF estimates.
Mexico has benefited from the U.S. economy’s resilience, but this tailwind could fade in 2025. More than 80% of Mexican exports go to the U.S., and tariffs would upend Mexico’s booming trade sector. Trade policy uncertainty is likely to weigh on business confidence and investment in the meantime. However, the domestic economy is on solid footing going into 2025. Household spending has fared well to date, unemployment is at historically low levels and financial conditions are becoming less restrictive. The IMF forecasts real GDP growth in Mexico will moderate to 1.3% this year, slightly undershooting its long-term average of around 1.5%.
Brazil is also expected to see lower growth in 2025. In response to stronger than expected inflation, Brazil’s central bank has been forced to walk back some of its recent interest rate cuts. According to the IMF, real GDP will moderate to 2.2% in 2025, but the prospect of additional monetary tightening could introduce downside risk to this forecast.
The IMF expects emerging market real GDP growth to remain stable at 4.2% in 2025. However, it is worth noting that slowdowns are expected for the largest emerging market economies, and this regional forecast reflects rebounds in several frontier economies that have undergone significant adjustments.
Key risk to outlook: Renewed trade tensions
While a positive consensus has formed among investors around the new Trump administration’s domestic economic policy proposals, much uncertainty surrounds the outlook for trade policy. A variety of tariff threats were made during the campaign and following Trump’s election, but the details are less clear.
The impact of the first trade war was limited
An examination of the 2018 trade war offers some insight into the potential impact of renewed trade tensions. The trade war began when President Trump placed a 25% tariff on $34 billion of imports from China in July 2018. Retaliatory Chinese tariffs followed shortly thereafter, and the conflict escalated in stages over the next two years, with tariffs ranging from 7.5% to 25% eventually covering most of the trade between the two countries. After several rounds of negotiations, a “Phase One” trade agreement was reached in early 2020. Despite the truce, U.S. tariffs remained in place on roughly $360 billion worth of Chinese goods while Chinese tariffs continued to apply to $100 billion of trade with the U.S.
The U.S.’s protectionist policies in the first trade war extended beyond China. Indeed, there were no initial exemptions to blanket tariffs on steel (25%) and aluminum (10%) in 2018. In contrast to China, tariffs were later eliminated on several partner countries, including Canada and Mexico. It is also worth noting that NAFTA was renegotiated during the first trade war. Though discussions were contentious, and uncertainty prevailed during the negotiations, the new trade deal (USMCA) maintained all the core features of the original trilateral pact.
Various economic analyses – including the Biden administration’s statutory review of the first trade war’s impact on the U.S. – concluded that tariffs on imported goods had minimal impacts on the domestic economy’s prices and employment and positive impacts on U.S. production in the sectors most directly affected by tariffs. In addition, the economic impact of retaliatory tariffs imposed by America’s trading partners was negligible. Tariffs were effective in reducing U.S. imports from China and increasing imports from alternate sources. These takeaways help explain the Biden administration’s decision to keep existing tariffs and introduce new ones in 2024 on an additional $18 billion of goods from China.
The trade war’s net effect on China was less benign. Goldman Sachs estimates that the combined effect of trade diversion and uncertainty lowered real GDP growth by about 0.7% in 2018-19. Meanwhile, Canada and Mexico grew at normal rates and were among the countries that gained U.S. import share during this period.
Uncertainties over tariffs loom
This time around, Trump has proposed a wider and more punitive set of tariffs. These measures include a 60% tariff on Chinese imports, a blanket 10% tariff on all imports regardless of origin and, more recently, a 25% tariff on USMCA partners Canada and Mexico. These proposals go well beyond the scope of what was seen in the first trade war.
Table 2 shows that the new proposed tariffs on imports may cost U.S. buyers an aggregate 2.6% of U.S. GDP. The cost is therefore estimated to be quite small relative to the overall size of the American economy.
Economic impacts threaten to be more pronounced outside of the U.S. For example, a 60% tariff on all Chinese goods would prove prohibitive to China’s trade. The direct impact of this negative trade shock is estimated to be a drag of around 2.0-2.5% of GDP, a clear headwind to China’s near-term outlook. Should events unfold in a manner like the last trade war, tariff rates could be differentiated by item, paused or postponed on certain goods, or even scaled up over time, limiting the rise in the average effective U.S. tariff rate to something below the 60% threat.
Meanwhile, China would likely try to offset some of the impact of higher U.S. tariffs with currency depreciation, trade rerouting and additional policy support for the domestic economy. Forecasting the ultimate impact is a complex and uncertain exercise given the numerous scenarios that might play out in future.
Estimated tariff costs to U.S. buyers of imports
| Tariff | Targeted imports (percentage of U.S. GDP) |
Average import price increase (percent) | Total cost (percentage of U.S. GDP) |
| Trade war (2018-19) | 1.8% | 20% | 0.4% |
| 10% on all goods | 9.8% | 10% | 1.0% |
| 60% on all Chinese goods | 1.6% | 50% | 0.8% |
| 25% on all Canadian and Mexican goods | 3.2% | 25% | 0.8% |
| Total cost of new tariffs | 2.6% |
A 25% tariff on imports from Canada and Mexico would have a material impact on both countries’ economies given the importance of their U.S. trading relationship. Exports to the U.S. currently total about $415 billion (19% of GDP) for Canada and $500 billion (28% of GDP) for Mexico. It is abundantly clear that high U.S. tariffs would place considerable pressure on both economies. However, a worst-case outcome is far from guaranteed.
For one, the interconnectedness of these three economies argues against blanket tariffs. Such measures would prove disruptive to U.S. companies with supply chains and production processes spanning across North American borders, particularly in the areas of automotive, machinery and equipment, and electronics manufacturing. Further, Canada is a critical supplier of energy to the U.S. and its trade surplus is largely explained by oil exports. It would not be in the U.S. government’s interests to undermine its own energy security.
Trump recently cited illegal immigration and illicit trade as reasons for imposing tariffs on Canada and Mexico. Trade and immigration were already linked in a similar way in 2019 when Trump threatened Mexico with a 25% tariff on all goods. By implementing stricter border controls and better aligning itself with U.S. immigration policies, Mexico maintained tariff-free access to the U.S. economy. Canada and Mexico at least have known deliverables for avoiding new American tariffs.
The first trade war underscores that the global economy undoubtedly faces another multi-year period of trade-related uncertainty. However, past experience highlights that, while the impact of tariffs varied on a country-by-country basis, the trade war did not have lasting effects on global growth in aggregate terms. While we do not downplay the risks posed by a resurgence of protectionism, we remain confident in the global economy’s medium-to long-term prospects.
Signs of froth for U.S. equities?
Equity markets attained successive new highs in the fourth quarter and closed the year with double-digit gains. The S&P 500 climbed 36.4% (total return in Canadian dollars), while the S&P/TSX was up 21.7%, MSCI ACWI 28.1% and MSCI Emerging Markets 17.3%.
While expectations of lower interest rates and pro-business fiscal policies explain some of the rise in U.S. and global indices in 2024, much is owed to the performance of a small subset of technology and tech-related companies. Indeed, the Magnificent 7 (Alphabet, Amazon, Apple, Meta, Microsoft, Nvidia, Tesla) accounted for nearly half of the S&P 500’s total gains. We reiterate our view that there may be too much optimism factored into the share prices of some of the Magnificent 7. These companies trade at a weighted average forward P/E of 36.1 – more than double the index’s long-term average level.
Of note, U.S. market concentration has reached its highest level in decades, surpassing the dotcom bubble era, a theme we explore in our December Portfolio Update letter. The ten largest companies within the S&P 500 collectively account for a remarkable 37% of the index’s market capitalization. In our assessment, this combination of lofty valuations and narrow index breadth underscores the market’s vulnerability to a shift in sentiment. We caution that volatility could jump if these companies’ performance falls short of investors’ optimistic assumptions.
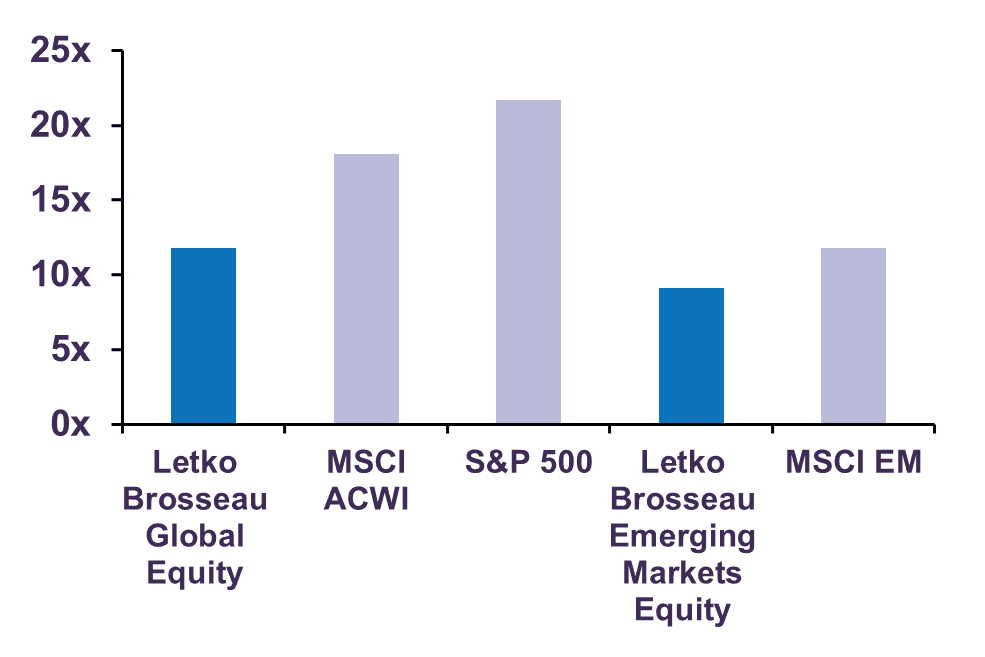
Amid signs that euphoria is forming in some pockets of the market, we have taken the opportunity to realize gains on several positions that have achieved or exceeded our valuation and return targets in recent months. Meanwhile, we exercised discipline in redeploying portfolio capital; our cash reserves have risen somewhat. On balance, we believe our equity holdings continue to provide attractive growth prospects over a 3-5-year horizon. The LetkoBrosseau global equity and emerging markets equity portfolios trade at substantial discounts to their benchmarks and offer compelling value at just 11.8 and 9.1 estimated 2025 earnings respectively (Chart 2).
In fixed income, our strategy remains unchanged. We estimate the fair value of 10- and 30-year Canadian government bonds to be around 4 – 4.5%, compared to their current yields of 3.23% and 3.33% respectively. This suggests longer-dated Canadian bonds are still expensive. As a result, we continue to avoid exposure to fixed income securities with a term above 10 years.
While we remain watchful of the risks from increased U.S. trade protectionism, we do not advocate for any material shifts in asset allocation. We are reducing exposure to fully valued companies but are maintaining a moderate tilt towards equities over cash and bonds.
Forward Price-to-Earnings Ratio
The information and opinions expressed herein are provided for informational purposes only, are subject to change and are not intended to provide, and should not be relied upon for, accounting, legal or tax advice or investment recommendations. Any companies mentioned herein are for illustrative purposes only and are not considered to be a recommendation to buy or sell. It should not be assumed that an investment in these companies was or would be profitable. Unless otherwise indicated, information included herein is presented as of the dates indicated. While the information presented herein is believed to be accurate at the time it is prepared, Letko, Brosseau & Associates Inc. cannot give any assurance that it is accurate, complete and current at all times.
Where the information contained in this presentation has been obtained or derived from third-party sources, the information is from sources believed to be reliable, but the firm has not independently verified such information. No representation or warranty is provided in relation to the accuracy, correctness, completeness or reliability of such information. Any opinions or estimates contained herein constitute our judgment as of this date and are subject to change without notice.
Past performance is not a guarantee of future returns. All investments pose the risk of loss and there is no guarantee that any of the benefits expressed herein will be achieved or realized.
The information provided herein does not constitute investment advice and it should not be relied on as such. It should not be considered a solicitation to buy or an offer to sell a security. It does not take into account any investor’s particular investment objectives, strategies, tax status or investment horizon. There is no representation or warranty as to the current accuracy of, nor liability for, decisions based on such information.
Certain information contained in this document constitutes “forward-looking statements,” which can be identified by the use of forward-looking terminology such as “may,” “will,” “should,” “expect,” “anticipate,” “target,” “project,” “estimate,” “intend,” “continue” or “believe,” or the negatives thereof or other variations thereon or comparable terminology. Due to various risks and uncertainties, actual events or results or the actual performance of the strategy(ies) may differ materially from those reflected or contemplated in such forward-looking statements.
The MSCI information may only be used for your internal use, may not be reproduced or redisseminated in any form and may not be used as a basis for or a component of any financial instruments or products or indices. None of the MSCI information is intended to constitute investment advice or a recommendation to make (or refrain from making) any kind of investment decision and may not be relied on as such. Historical data and analysis should not be taken as an indication or guarantee of any future performance analysis, forecast or prediction. The MSCI information is provided on an “as is” basis and the user of this information assumes the entire risk of any use made of this information. MSCI, each of its affiliates and each other person involved in or related to compiling, computing or creating any MSCI information (collectively, the “MSCI parties”) expressly disclaims all warranties (including, without limitation, any warranties of originality, accuracy, completeness, timeliness, non-infringement, merchantability and fitness for a particular purpose) with respect to this information. Without limiting any of the foregoing, in no event shall any MSCI Party have any liability for any direct, indirect, special, incidental, punitive, consequential (including, without limitation, lost profits) or any other damages. (www.msci.com).
The S&P/TSX Index is a product of S&P Dow Jones Indices LLC or its affiliates (“SPDJI”) and TSX Inc., and has been licensed for use by Letko, Brosseau & Associates Inc. Standard & Poor’s® and S&P® are registered trademarks of Standard & Poor’s Financial Services LLC (“S&P”); Dow Jones® is a registered trademark of Dow Jones Trademark Holdings LLC (“Dow Jones”); and these trademarks have been licensed for use by SPDJI and sublicensed for certain purposes by Letko, Brosseau & Associates Inc. TSX® is a registered trademark of TSX Inc., and have been licensed for use by SPDJI and Letko, Brosseau & Associates Inc. Letko, Brosseau & Associates Inc.’s product is not sponsored, endorsed, sold or promoted by SPDJI, Dow Jones, S&P, their respective affiliates, or Bloomberg and none of such parties make any representation regarding the advisability of investing in such product(s) nor do they have any liability for any errors, omissions, or interruptions of the S&P/TSX Index.
Concerned about your portfolio?
Subscribe to Letko Brosseau’s newsletter and other publications: