 Canada - FR
 U.S. - EN
Global equity markets continue to exhibit elevated volatility. While some areas of the market have already begun to price in the anticipated impact of tariffs and shifting trade dynamics, uncertainty remains amid shifting timelines, evolving policies, and ongoing trade negotiations. Year-to-date total returns as of April 30th for the S&P 500 was down 8.7% (in Canadian dollars) and MSCI ACWI down 4.3 %. Conversely, the S&P/TSX posted a 1.4% gain, while the MSCI EAFE rose 7.3% and MSCI Emerging Markets rose 0.2%.
Amid this environment, the Canadian energy sector continues to draw attention given its sensitivity to global policy developments. The energy sector has long been shaped by policy shifts, supply-side constraints, and geopolitical events—from sanctions to OPEC production decisions—making it no stranger to volatility. This has transformed the sector’s landscape over recent years, and we have taken various steps to mitigate these associated risks, while adding value to our clients’ portfolios.
Sanctions! War! OPEC! Trump! Energy markets are volatile, so how do we focus on making money in the long run?
Depending on the headline of the day, oil price movements over the last five years have periodically been whipsawed to the upside or downside. Between U.S. sanctions on major producers like Russia, the threat of tariffs, OPEC decisions, and geopolitics, the oil market has been faced with a barrage of uncertainty, creating ample variability in oil markets and company share prices.
While these risks are important and must be carefully considered, our investment philosophy is grounded in a deep understanding of energy market fundamentals. We rely on a rigorous bottom-up research process, which aims to expose our portfolio to high-quality, diversified and reasonably priced companies that are well-positioned to navigate short-term volatility, while delivering both income and long-term growth. Many of the companies we are invested in today exhibit these characteristics such as Suncor Energy, Cenovus Energy, Peyto Exploration, Tourmaline Oil, among others.
From pandemic lows, to wartime highs, to today
In 2020, during the early stages of the COVID-19 pandemic, oil prices plummeted following the collapse in demand caused by the immobilization of society (Chart 1). Concerns arose regarding the long-term outlook for the oil market and questions surfaced about whether the growing momentum of energy transition initiatives would prevent a full recovery to pre-pandemic levels.
Last Five Years: LBA Canadian Energy Weight vs Oil Prices (US$/barrel)
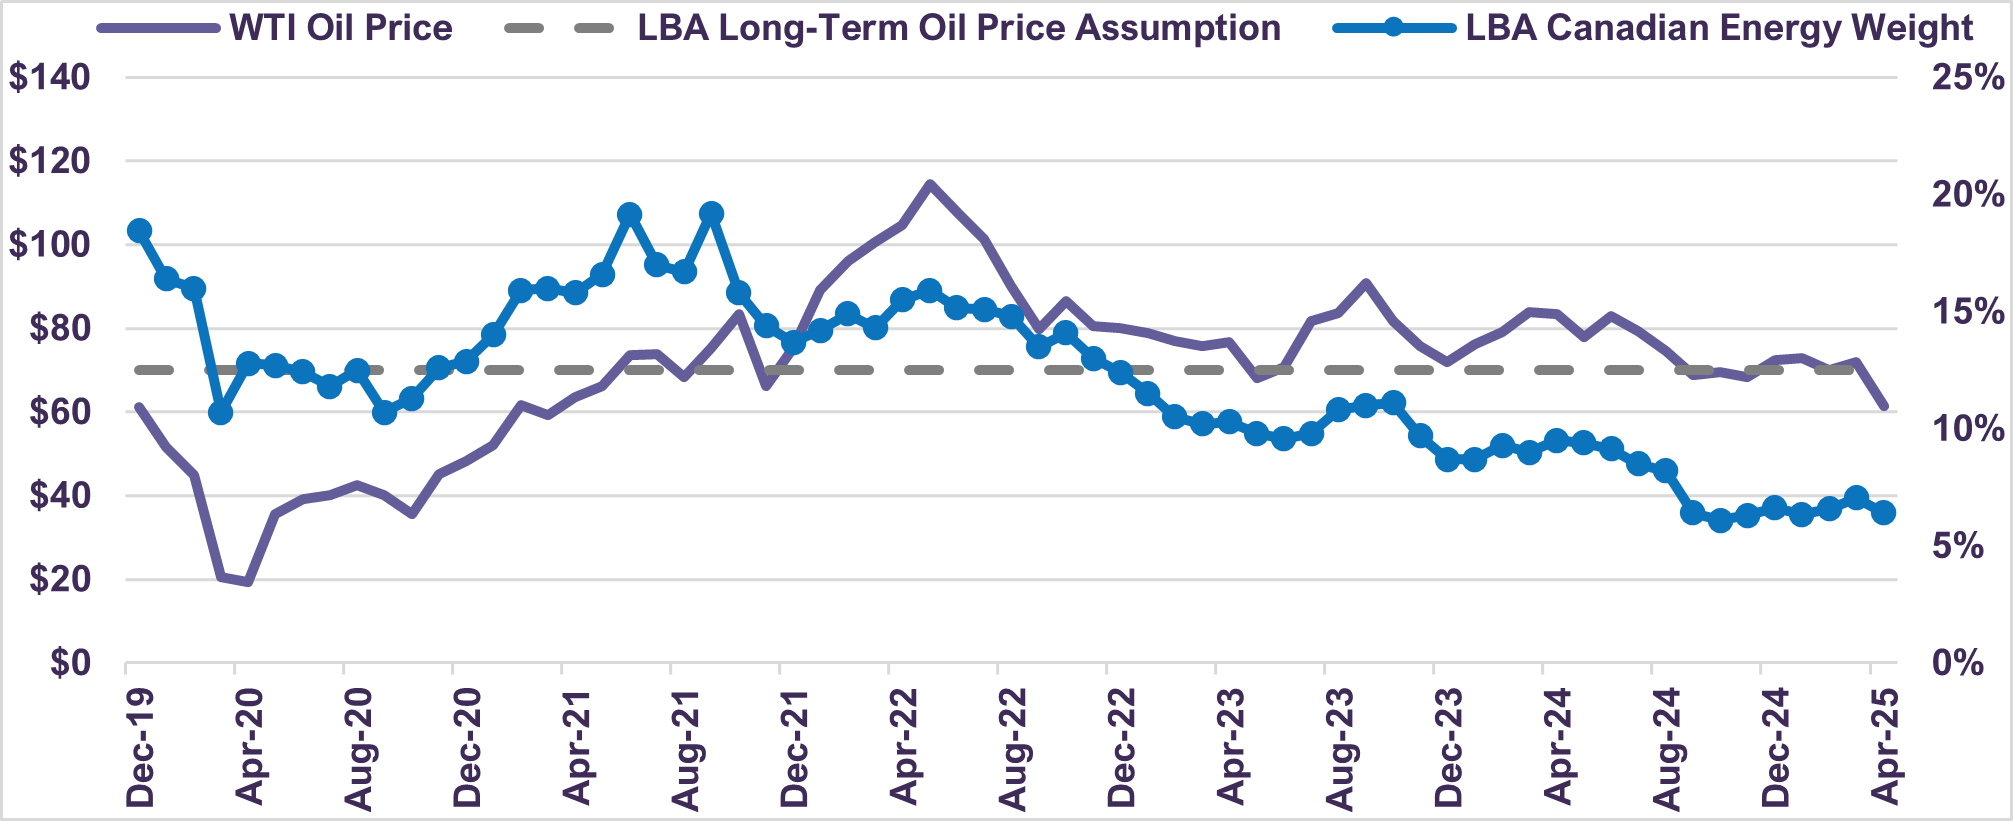
In response, we conducted an in-depth analysis of the oil market’s long-term drivers, concluding that the market would not only recover to pre-pandemic levels of demand, but that oil prices would likely rise much higher as well. Despite prevailing oil prices trading around $40 per barrel at the time, we believed the market would require a long-term price of at least $60-70 per barrel—and, at times, likely much higher—in order to incentivize enough supply to meet demand. Today, we still view $70 as an appropriate long-term assumption. Our findings were detailed in our report, The Climate is Changing. Electric Vehicles are Coming. Should We Still Invest in Oil?.
A well-grounded long-term view on oil market supply and demand fundamentals is critical, as it enables us to derive oil price assumptions that inform the intrinsic value of oil-producing companies. We refer to this as our Net Asset Value (NAV) analysis. During the pandemic, we applied a conservative long-term price assumption of $60 per barrel, which indicated substantial upside potential for the oil-related stocks. As a result, we tactically increased our exposure to the energy sector across portfolios. While most of our clients hold globally diversified portfolios, our most active positioning in the sector was within the Canadian equity segment. By mid-2021, energy represented nearly one-fifth of our Canadian equity portfolios and roughly one-tenth of global equity portfolios. This compared to an energy sector weight of 13.0% in the S&P/TSX Composite and 3.5% in the MSCI ACWI benchmark during this period.
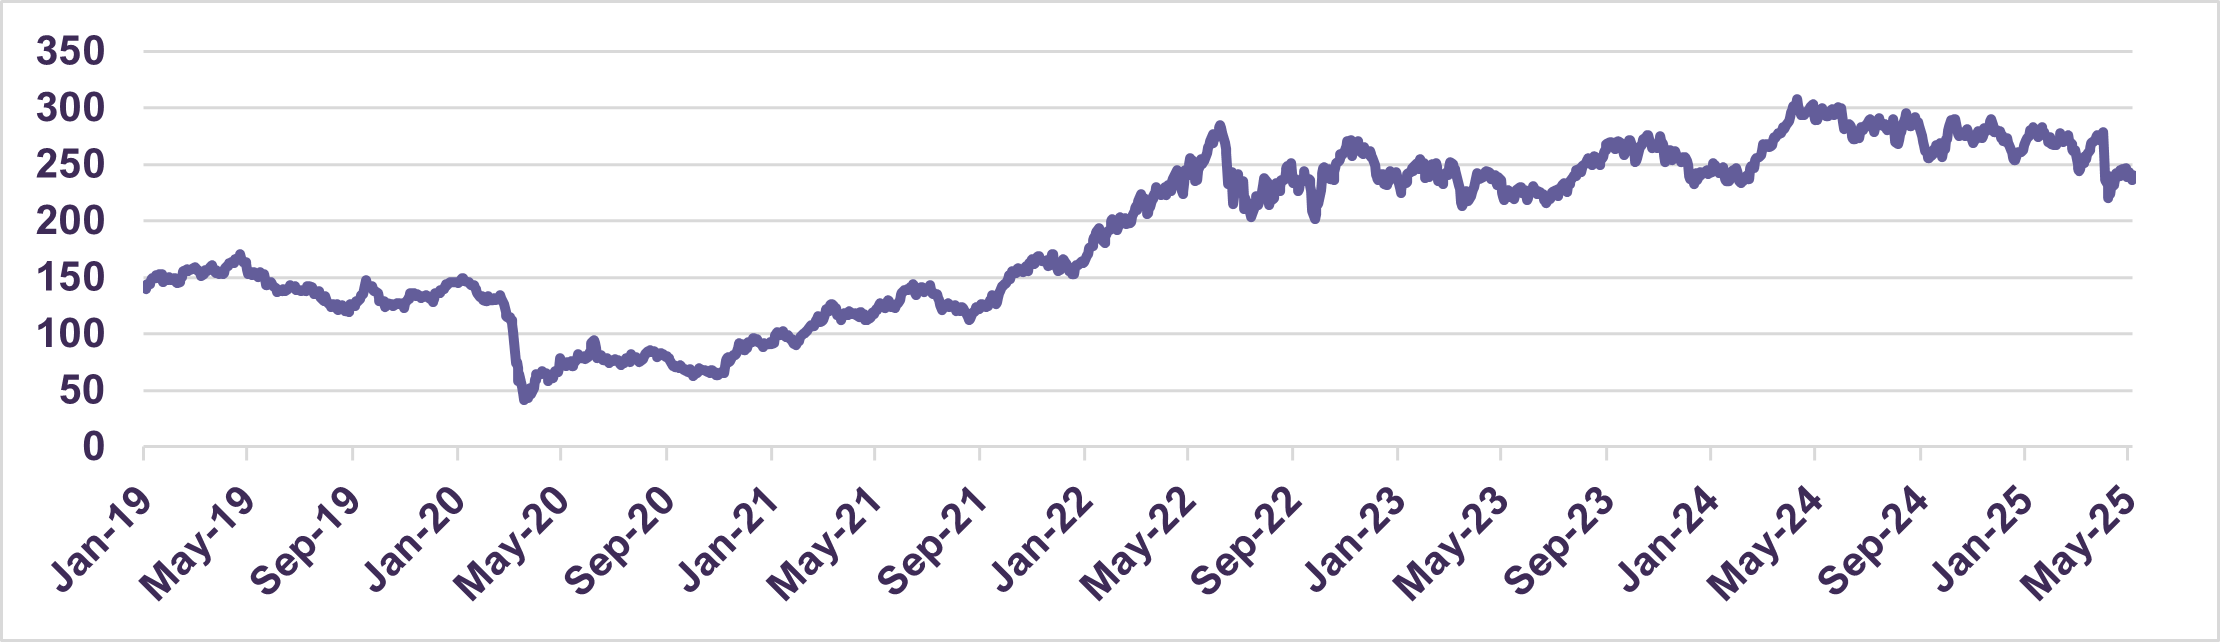
As geopolitical tensions escalated in 2022 with the onset of Russia’s war in Ukraine, oil prices surged to $120 per barrel. By mid-2022, the S&P/TSX Capped Energy Index had increased by 580% from its pandemic lows (Chart 2). Applying our NAV analysis, we saw that some stock prices were pricing in long-term oil prices of $80-90 per barrel, well above our $70 long term assumption. As a result, we aggressively trimmed our holdings. Today our energy weight in Canada sits at nearly 6.2% compared to the S&P/TSX Composite benchmark at 16.2%, while our global equity portfolios hold an energy weight of approximately 4.9% compared to the MSCI ACWI benchmark at 3.7%.
Since June 2022, oil prices have declined by almost 50%, settling around $60 per barrel, while share price returns have weakened; the S&P/TSX Capped Energy Index declined by 16% over this period.
S&P/TSX Capped Energy Index
What’s next for the oil market?
Our macro-oil market analysis is informed by both supply and demand factors.
On the demand side, the dynamics are in the midst of undergoing a striking transformation. In the decade preceding the pandemic from 2010 to 2019, global oil demand grew at a healthy 1.4% compound annual growth rate (CAGR). One country—China—was responsible for almost half of this growth. However, structural developments, including the widespread adoption of electric vehicles (EVs), where EVs now account for over 50% of Chinese new car sales, and the substitution in the trucking industry away from diesel towards compressed natural gas, present headwinds. As a result, due to both slowing Chinese demand growth and a continued shallow decline in Developed Market demand, we assume structurally lower oil demand growth moving forward compared to the pre-pandemic rate. Current economic uncertainty adds further downside risk.
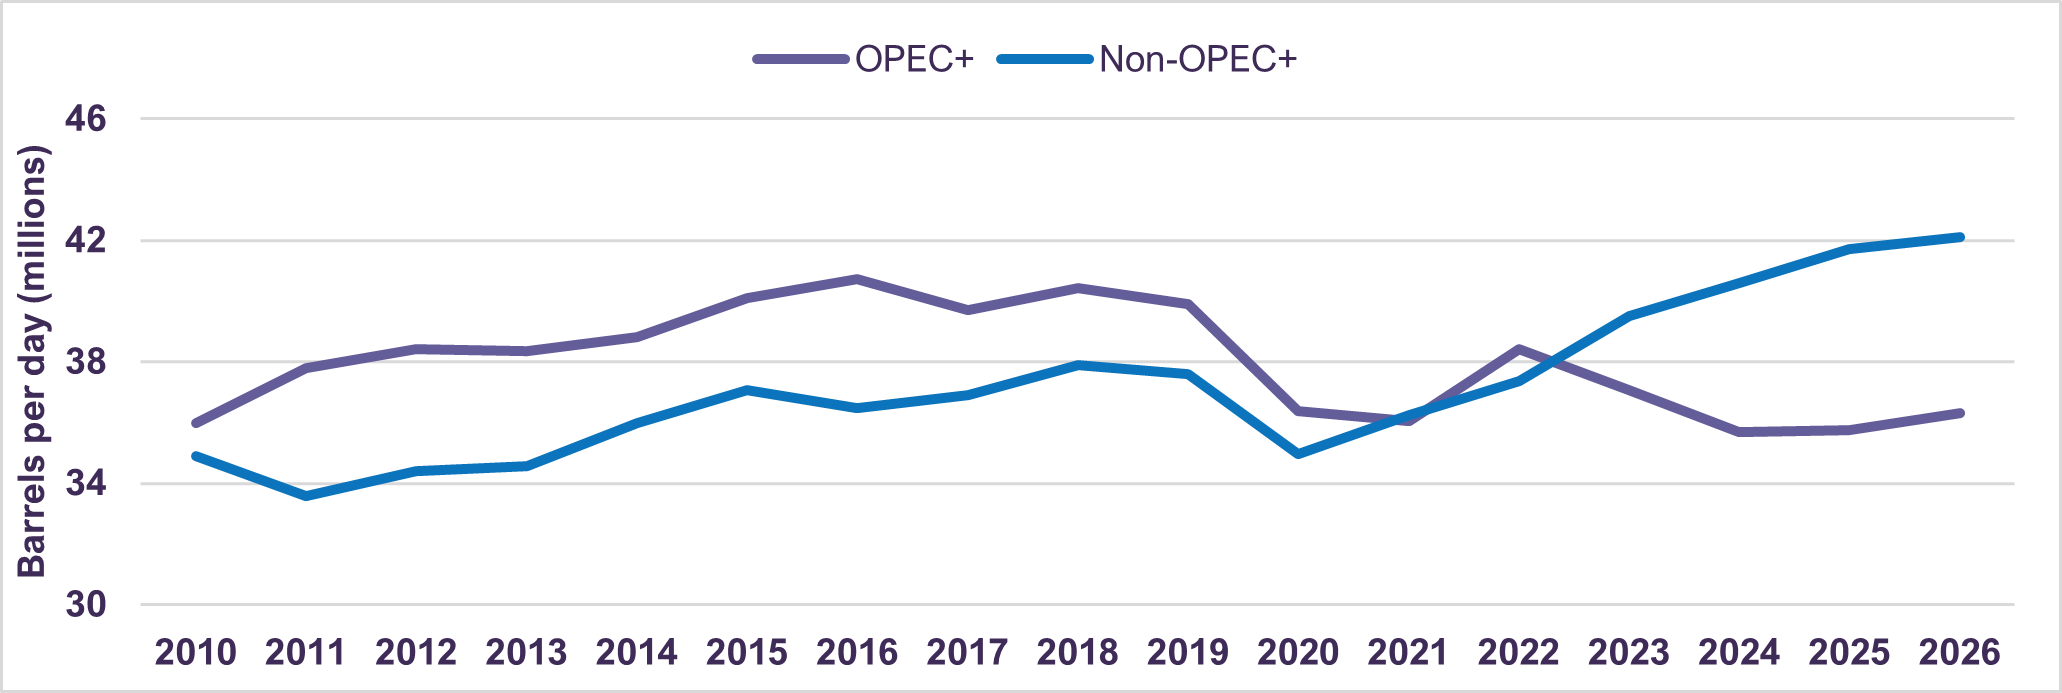
On the supply side, the world can be divided between OPEC+ (the cartel of countries that act in unison to influence prices, controlling over 50% of global supply), and non-OPEC+ (countries like the US, Canada, Brazil, Norway, and others that act independently). As non-OPEC+ is expected to grow by about 1.3% of global supply in 2025, we believe there is limited room for OPEC+ to raise their own production (Chart 3). Therefore, given demand headwinds and strong supply growth, we believe downside risk to oil prices remains, and we continue to be cautious with our positioning. Of course, shifts in sanctions policy—such as those affecting Iran—along with changes in tariffs, economic activity, and other key factors can lead to a revision of this outlook.
OPEC+ vs Non-OPEC+ Crude Oil Production
As such, we continuously monitor these developments closely to ensure our positioning remains well-informed and responsive to evolving market dynamics. Below, we provide insights into two of our key holdings, ConocoPhillips and Cenovus Energy, both of which are well-aligned with our long-term market outlook:
ConocoPhillips is the largest independent oil and gas exploration and production company in the U.S. and is considered a blue-chip stock within the industry. The company boasts a solid management team and best-in-class operating track record. With a diversified resource base spanning the U.S. Lower 48, Alaska, Canada, Norway, the Middle East, and Asia Pacific, ConocoPhillips is well-positioned to continue to grow its production profile. Additionally, ConocoPhillips has proven itself as a leader in sector consolidation, executing large-scale, accretive transactions that enhance its portfolio. Importantly, the company maintains a robust shareholder return policy, distributing at least 30% of its cash flow annually through dividends and share buybacks, providing investors with attractive returns visibility.
By March 2022, we had reduced our exposure to ConocoPhillips by nearly 70%, following a substantial 317% increase in its share price from its trough two years earlier. ConocoPhillips currently trades at 13.4 times forward earnings and offers a 3.5% dividend yield. The company is forecasted to grow earnings per share by more than 10% on a compound annual basis from 2025 to 2030.
Cenovus is a premier integrated energy company with significant hydrocarbon reserves, particularly in the Canadian oil sands and offshore assets in China and Indonesia. The company’s upstream production is largely weighted towards liquids, with 77% coming from the Canadian oil sands developed using the In Situ steam-assisted gravity drainage process. This allows Cenovus to benefit from both its upstream production and a strong refining footprint, which provides a hedge for its heavy oil production. Cenovus is a low-cost operator, with a break-even point of just $45 per barrel WTI where it covers its capital spending and dividend, and its conservative debt levels provide resilience in a volatile commodity price environment. The company is committed to shareholder returns, paying out 100% of its surplus free cash flow through dividends and share buybacks, with a potential payout yield of 15% at current share prices.
We nearly doubled our exposure to Cenovus beginning in 2021 following depressed valuations and began reducing our exposure to lock in gains in the latter half 2022 following a 310% increase in share price from its trough two years prior. Cenovus currently trades at 3.5 times forward cash flow per share, while offering a 4.3% dividend yield. The company is forecasted to grow cash flow per share at a 9% compound annual growth rate (CAGR) from 2024 to 2029.
Concluding Thoughts
The past five years have been marked by significant volatility in oil markets, driven by the pandemic, various sanctions regimes, geopolitical conflicts, and evolving OPEC policies amongst other factors. While these developments warrant close attention, it would be a tall order to foresee them with perfectly timed portfolio decisions. Instead, we favour a comprehensive oil market macro framework that assesses supply and demand fundamentals, forming the basis of our long-term price expectation. This framework, combined with rigorous bottom-up company-level valuation, provides the conviction needed to make informed investment decisions.
Given the inherent volatility of the energy sector, we mitigate risks by investing in high-quality companies with strong balance sheets, low-cost production, long resource lives, and proven management teams. By focusing on fundamentally resilient businesses, we look beyond short-term fluctuations, prioritizing capital preservation and delivering sustainable long-term returns for our clients.
Where the information contained in this presentation has been obtained or derived from third-party sources, the information is from sources believed to be reliable, but the firm has not independently verified such information. No representation or warranty is provided in relation to the accuracy, correctness, completeness or reliability of such information. Any opinions or estimates contained herein constitute our judgment as of this date and are subject to change without notice.
Past performance is not a guarantee of future returns. All investments pose the risk of loss and there is no guarantee that any of the benefits expressed herein will be achieved or realized.
The information provided herein does not constitute investment advice and it should not be relied on as such. It should not be considered a solicitation to buy or an offer to sell a security. It does not take into account any investor’s particular investment objectives, strategies, tax status or investment horizon. There is no representation or warranty as to the current accuracy of, nor liability for, decisions based on such information.
Certain information contained in this document constitutes “forward-looking statements,” which can be identified by the use of forward-looking terminology such as “may,” “will,” “should,” “expect,” “anticipate,” “target,” “project,” “estimate,” “intend,” “continue” or “believe,” or the negatives thereof or other variations thereon or comparable terminology. Forward-looking statements are inherently subject to, among other things, risks, uncertainties and assumptions regarding currencies, economic growth, current and expected conditions, and other factors that are believed to be appropriate in the circumstances which could cause actual events, results, performance or prospects to differ materially from those expressed in, or implied by, these forward-looking statements. Readers are cautioned not to place undue reliance on these forward-looking statements.
The MSCI information may only be used for your internal use, may not be reproduced or redisseminated in any form and may not be used as a basis for or a component of any financial instruments or products or indices. None of the MSCI information is intended to constitute investment advice or a recommendation to make (or refrain from making) any kind of investment decision and may not be relied on as such. Historical data and analysis should not be taken as an indication or guarantee of any future performance analysis, forecast or prediction. The MSCI information is provided on an “as is” basis and the user of this information assumes the entire risk of any use made of this information. MSCI, each of its affiliates and each other person involved in or related to compiling, computing or creating any MSCI information (collectively, the “MSCI parties”) expressly disclaims all warranties (including, without limitation, any warranties of originality, accuracy, completeness, timeliness, non-infringement, merchantability and fitness for a particular purpose) with respect to this information. Without limiting any of the foregoing, in no event shall any MSCI Party have any liability for any direct, indirect, special, incidental, punitive, consequential (including, without limitation, lost profits) or any other damages. (www.msci.com).
The S&P/TSX Index is a product of S&P Dow Jones Indices LLC or its affiliates (“SPDJI”) and TSX Inc., and has been licensed for use by Letko, Brosseau & Associates Inc. Standard & Poor’s® and S&P® are registered trademarks of Standard & Poor’s Financial Services LLC (“S&P”); Dow Jones® is a registered trademark of Dow Jones Trademark Holdings LLC (“Dow Jones”); and these trademarks have been licensed for use by SPDJI and sublicensed for certain purposes by Letko, Brosseau & Associates Inc. TSX® is a registered trademark of TSX Inc., and have been licensed for use by SPDJI and Letko, Brosseau & Associates Inc. Letko, Brosseau & Associates Inc.’s product is not sponsored, endorsed, sold or promoted by SPDJI, Dow Jones, S&P, their respective affiliates, or Bloomberg and none of such parties make any representation regarding the advisability of investing in such product(s) nor do they have any liability for any errors, omissions, or interruptions of the S&P/TSX Index.
Concerned about your portfolio?
Subscribe to Letko Brosseau’s newsletter and other publications: