 Canada - FR
 U.S. - EN
Net-Zero Research Series Part 1:
Understanding the Science
Introduction
Welcome to the first installment of our Net-Zero Research Series, a collection of insights from our Climate Change Committee. The series will explore various topics, including the science behind climate change, the largest sources of emissions, and the potential pathways to mitigating global warming. We will take a deep dive into the concepts and implications of transitioning to a world in which we balance emissions of greenhouse gases with their removal or elimination (net-zero) and will share conclusions that directly inform our investment analysis and portfolio strategy.
Our Climate Change Committee plays an active role in identifying investment risks and opportunities arising from climate change, both in our portfolios and, more broadly, in capital markets. Comprised of a cross-section of our firm’s portfolio managers and investment professionals, the Committee conducts climate change scenario analysis. This entails examining potential global physical changes and how these, in-turn, impact the macroeconomic environment, government policy, regulation, sector and industry dynamics, and individual company performance.
Our role as an investment manager is multilayered. On the one hand, we want to participate in efforts to limit global warming through company engagement and be at the forefront of socially responsible investments. On the other hand, it is important that we remain clear-eyed and fully understand the economic, scientific, social, and political implications of the transition to a lower-carbon economy, all while fulfilling our fiduciary duty to earn a sustainable return on your investments.
In this first piece, we will lay the foundation for the series through an analysis of the science behind climate change, the sources of emissions, the potential physical impacts of climate change, and what it means to work towards a net-zero emissions scenario.
The Situation – The Climate is Changing
Key Takeaways
- Global average temperatures are rising as a result of increased greenhouse gas emissions from human activities.
- Greenhouse gas emissions are embedded in every part of human society, including electricity and heat generation, industrial processes, agriculture, transportation, and buildings.
- Temperatures have already increased 1.07 degrees Celsius since pre-industrial times (1850-1900), enough to drive long-term changes to the Earth’s climate. Temperatures will continue to rise if emissions persist.
How is the Earth’s temperature changing?
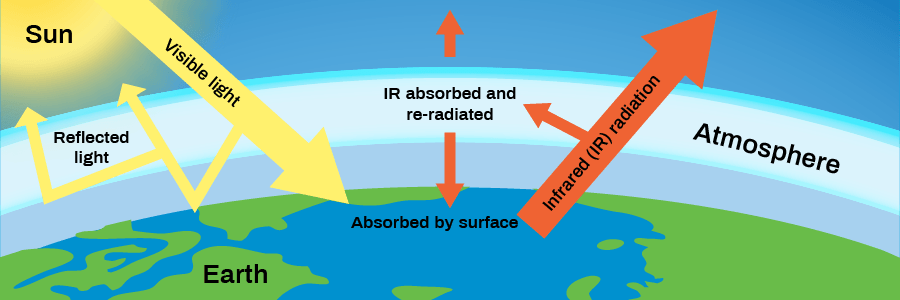
To understand climate change, we need to look at its underlying driving force. This force is the Greenhouse Effect, which refers to the natural warming of the earth that results when gases in the atmosphere trap heat from the sun that would otherwise escape into space [i]. Basic physics are at play: approximately 30% of solar energy directed at Earth is reflected back into space by clouds, atmospheric particles and reflective surfaces (snow and ice), while approximately 70% is absorbed by land, oceans and atmosphere. Not only does the absorbed energy heat the planet, but it is re-emitted away from the Earth in the form of infrared light. Some of this continues into space, but as much as 90% is captured by Greenhouse Gases (GHGs) (including carbon dioxide, methane, and nitrous oxide) and redirected back to Earth and the surrounding atmosphere. The higher the concentration of GHGs in the atmosphere, the harder it is for energy to escape. This is what causes global warming[ii].
Greenhouse Gas Effect
What are Greenhouse gas and temperature levels today?
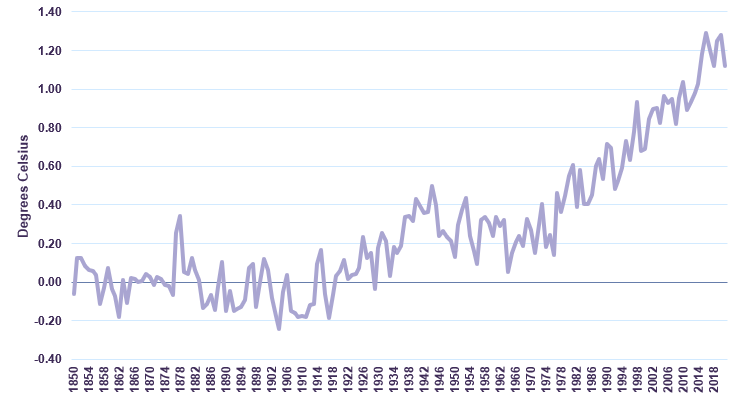
The concentration of GHGs in the Earth’s atmosphere was between 200 and 280 parts per million (ppm) (i.e., 200 molecules of gases per million molecules of air) for most of the past 800,000 years[iii]. In the past century alone, the concentration of GHGs has increased to more than 400ppm. Higher concentrations of GHGs have caused additional heat to be trapped in the earth’s atmosphere, consequently driving up global temperatures [iv]. The higher the concentration of GHGs, the greater this effect over time. Scientists estimate that global average temperatures have risen by approximately 1.07 degrees Celsius since pre-industrial times (1850-1900). Although this may sound like a small amount, climate modeling has shown that small changes are enough to drive long-term shifts in the Earth’s climate. More energy in the climate system can also lead to increased weather volatility and more extreme meteorological conditions. This process takes time to unfold, multiple decades in fact, and we will continue to see temperature increases into the mid-century due to GHGs currently being emitted.
Global Average Temperature Change Relative to Pre-Industrial Era Average (1850-1900)
How did we get here?
Decades of studying this complex relationship has led to a consensus within the international scientific community: human activities are the cause of global warming. The Sixth Assessment Report (AR6), released by the UN Intergovernmental Panel on Climate Change (UN IPCC) in August 2021, compiled from more than 14,000 scientific papers from the world’s top climate scientists, concluded that “it is unequivocal that human influence has warmed the atmosphere, ocean and land” and the “observed warming is driven by emissions from human activities”. Carbon dioxide (CO2) emissions released into the atmosphere through the burning of fossil fuels (coal, oil, and gas) are a major culprit, as are methane and nitrous oxide emissions from other activities.
What Are the Sources of Emissions?
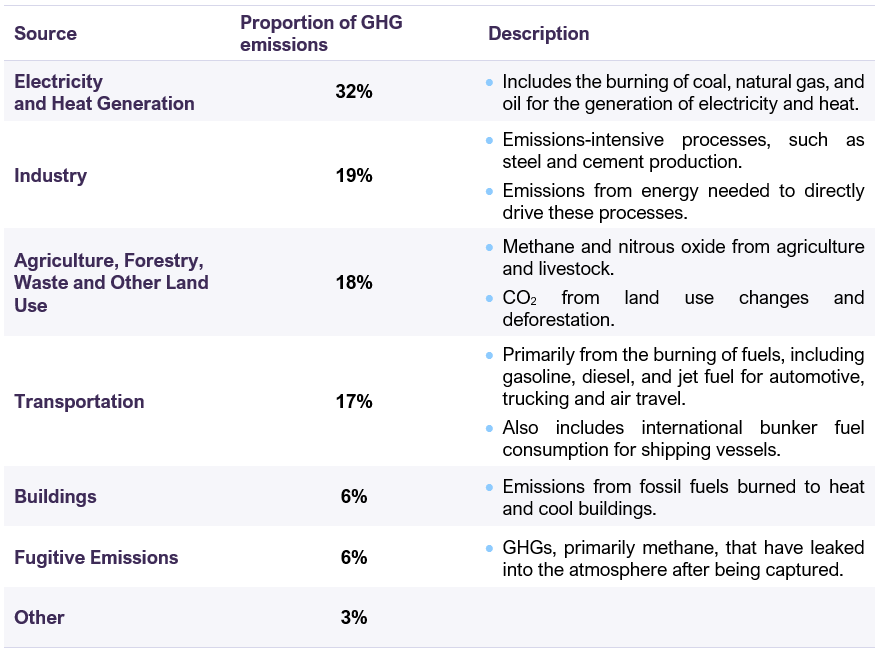
The leading causes of GHG emissions permeate much of our current way of life. They are integral in how we power our homes and businesses, manufacture products, construct infrastructure, grow our food, and move around. By far, the largest source of global GHG emissions is energy and heat generation (Figure 3). Much of the developing world still burns coal for their energy needs. According to the IEA, in 2019 China and India relied on coal for 61% and 71% of their total energy generation needs, respectively.
Global Greenhouse Gas Emissions By Source
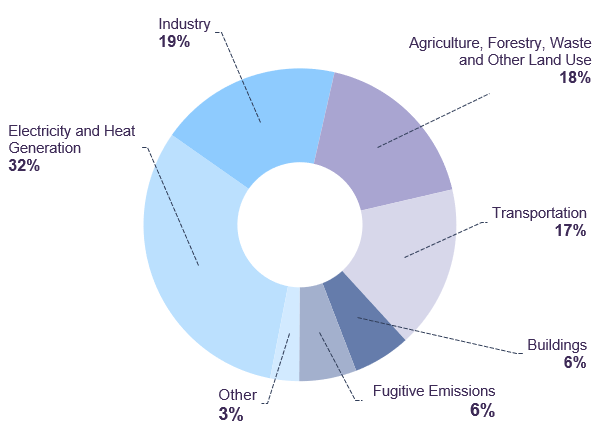
Global Sources of Emissions
Emissions are clearly interlinked with our way of life and are affecting the earth’s climate. A key question is: how do we know when emissions are too much?
The Problem – Emissions are Pushing the Climate Too Far, Too Quickly
Key Takeaways
- Climate modeling shows that a global average temperature increase of 1.5 or 2.0 degrees Celsius will have significant detrimental effects on the global climate and ecosystems.
- When we look at a spectrum of climate modeling scenarios, there is a high probability we will breach these temperature thresholds in the next few decades, even with considerable emissions mitigation efforts.
- The ability to bring temperatures back down below key thresholds will depend on structural emissions reduction efforts, international coordination, and emerging market (EM) countries’ ability to transition.
- If emissions and temperature levels are not reduced, extreme weather events and rising sea levels are likely to have a harmful impact on human society and global ecosystems.
Understanding Temperature Thresholds
When the concept of global warming was first introduced in the 1970’s, scientists attempted to understand the potential long-term detrimental effects of a warming climate. They hypothesized that exceeding 2 degrees Celsius above pre-industrial levels would create conditions never before seen by human civilization[v], and would likely lead to variations in climate conditions well outside the usual annual cycles. The +2 degrees Celsius scenario was adopted by the broader scientific community for climate change analysis and has been used as a threshold ever since. Improvements in climate modeling over the last fifty years have confirmed that a 2 degrees Celsius increase over pre-industrial levels would have long-term detrimental effects on the Earth’s climate and ecosystems.
A UN special study from 2015 highlighted that a target of 1.5 degrees Celsius would be a more suitable threshold. The study showed that the relationship between global average temperature increases and the detrimental impact of climate change is non-linear. As such, a 1.5 degrees threshold would have a significantly less harmful impact on the planet than a 2 degrees threshold.
The international community and industry leaders have therefore pledged to hold global average temperatures to below 2 degrees Celsius, and ideally, to the stricter target of 1.5 degrees Celsius. These temperature targets are now widely accepted and serve as a guide for organizations in laying out their plans to mitigate the already significant impacts of global warming.
Carbon Budgets: a useful tool for measuring how long until thresholds are crossed
To understand when we may potentially breach these temperature thresholds in the future, we can use a tool called the Carbon Budget. A carbon budget is defined as “the cumulative amount of CO2 emissions permitted over a period of time to keep within a certain temperature threshold” . Said another way, “a carbon budget is a simplified way to measure the additional emissions that can enter the atmosphere if the world wishes to limit global warming to levels such as 1.5⁰C”[vii].
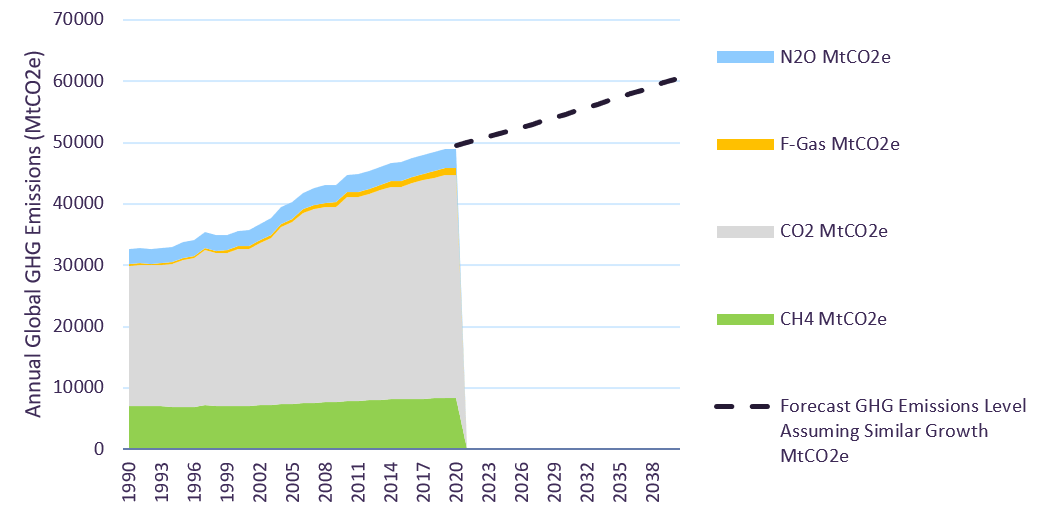
Global GHG emissions have increased steadily over the last 30 years (Figure 4). As of 2018, global GHG emissions were 48.9 Gigatonnes (Gt) of CO2 equivalent per year. The UN IPCC estimates that for global temperatures to remain below 2 degrees Celsius, with a 67% probability of success, we have approximately 1150Gt of CO2 remaining in the carbon budget. If we assume current emission levels continue to grow at the same rate as the last decade, approximately 1% per year, we would consume the carbon budget in approximately 20 years. Using the stricter temperature target of 1.5 degrees Celsius, 400Gt CO2 remains in the carbon budget, meaning we would burn through it in only 7 years (Table 2).
Historical Annual GHG Emissions Levels and Forecast Assuming Similar Growth
Target Temperatures and Carbon Budget
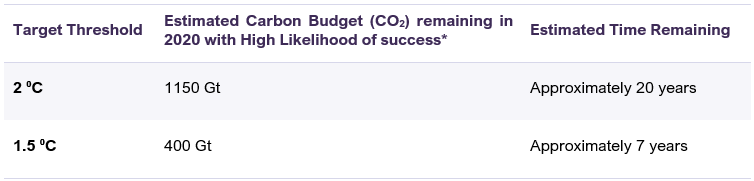
*High Likelihood values correspond to 67% in the IPCC report.
Shared Socioeconomic Pathways offer more nuanced climate modelling
Global emissions are unlikely to continue to rise in a simple linear fashion. Emission levels will change over time as humans react, or do nothing, to address climate change. The recent IPCC AR6 report sets out scenarios called Shared Socioeconomic Pathways (SSPs), which allow scientists to integrate socioeconomic assumptions into climate change model outcomes and forecasts for future temperature changes. These assumptions include the level of international coordination, changes in energy usage, and adoption of emission mitigation measures.
It is worth keeping in mind that these SSP scenarios are approximate outcomes only. Socioeconomic conditions, for example, are likely to shift over time and cannot be completely captured in model assumptions today. However, they can lend us directional information that is beneficial for our analysis. Table 3 lays out each SSP scenario with a respective estimate of what the global temperature increase might be.
Shared Socioeconomic Pathways
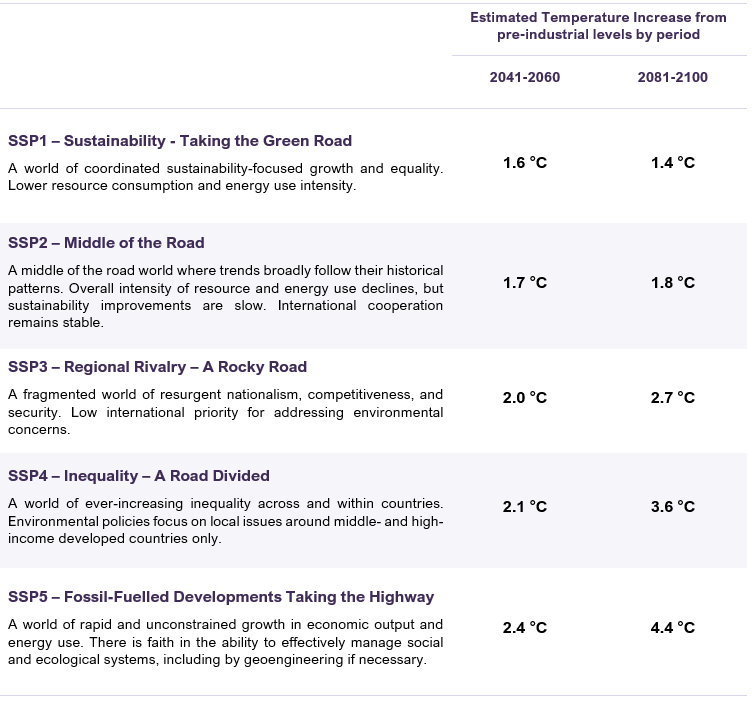
Interestingly, SSP1, a scenario with the most commitment to emissions reduction, forecasts a temperature increase of approximately 1.6 ⁰C by the 2041-2060 period. This forecast is already higher than the 1.5 ⁰C threshold set out by the Paris Agreement in 2015. On the other hand, the SSP5 scenario, where the use of fossil fuels proliferates, forecasts a temperature increase of approximately 2.4⁰C by the 2041-2060 period. In fact, the AR6 report explains that “in all scenarios assessed, the central estimate of crossing the 1.5⁰C threshold lies in the early 2030s”.
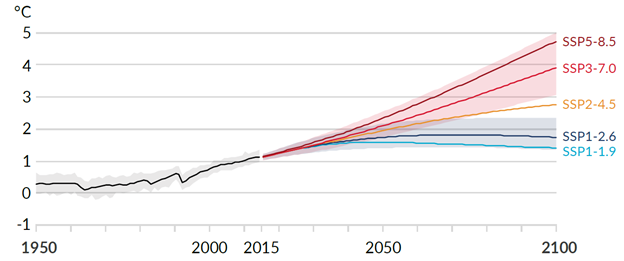
That being said, the scenarios and underlying scientific studies also show evidence that cutting emissions can stabilize and even reduce global average temperatures over the longer-term, and eventually bring temperatures below the 1.5⁰C or 2.0⁰ Celsius threshold.
Global Surface Temperature Change Relative to 1850 – 1900 by SSP
When trying to determine the most likely pathway, we believe that, barring an unforeseen and dramatic shift in socioeconomic conditions, a scenario such as SSP5 (Table 3), where fossil fuel use accelerates is unlikely. There is considerable international pressure, public concern, and implementation of laws and regulations to combat emissions growth today. Emissions reduction efforts, such as replacement of fossil fuel power plants with renewable energy, the emergence of electric vehicles, establishment of carbon pricing and trade systems, and signing of international agreements to tackle future emissions are already underway. We believe these efforts will continue to be implemented and improved.
On the other hand, a scenario such as SSP1, where the widely accepted goal is an immediate and coordinated move towards lowering emissions, is also less probable. It is not to say that there is little effort for emissions reduction, or that momentum is not building; but we believe this process is likely to occur slower than the SSP1 scenario projects. The use of fossil fuels, such as oil, is inextricably linked to our way of life and reducing total global GHG emissions by 45% by 2030 as SSP1 calls for, would be too disruptive for the global economy to handle. Our feature report “The climate is changing. Electric vehicles are coming. Should we still invest in oil?” provides an in-depth look at the challenges we face in weaning off fossil fuels.
In addition, the level of international coordination is slow and inequality in nations’ willingness or capacity to address climate change is evident. Many emerging market countries still rely heavily on coal for energy generation and emissions-intensive processes, such as cement and steel production, manufacturing, and agriculture, for improving the quality of life of their citizens. Recent debates at summits, such as COP26 (Conference of the Parties 26), highlight that developing countries cannot (and will not) shoulder the costs of mitigating climate change that ultimately results from developed countries’ historical emissions. Meanwhile, developed countries have been slow to lend financial assistance.
We believe a likely scenario is somewhere in between SSP2 and SSP4, where emissions mitigation efforts continue but momentum builds at a slower pace. Based on the scenarios studied, we are likely to see temperatures above 1.5 degrees Celsius in the next half century. Beyond this time frame, the specific pathways to reducing emissions for each source, the level of international coordination, and the capacity for emerging market economies to reduce emissions as they continue to grow will be key determinants of whether temperature levels can be brought back below those thresholds. Our Net-Zero Research Series will take a deeper dive into each of the sources of emissions, the potential emission mitigation strategies, and the pace at which these strategies might occur.
How does climate change impact the planet?
Given the scenarios for the future described earlier, we can ask: how will increased global average temperatures translate into physical changes around the globe, and are they cause for concern?
A common pushback to concerns over climate change is the claim that throughout Earth’s 4.5 billion years, there have been periods with higher atmospheric concentrations of CO2 and higher global average temperatures than the SSP scenarios forecast. Life continued and even flourished, and the climate was relatively stable for long intervals of time. So why is there a need to spend considerable effort and resources in addressing climate change when the Earth has seen these conditions before? Can we simply adapt to them?
While we would agree that there have been past periods with higher CO2 concentrations and warmer temperatures than we see in climate projections, the key difference is the speed at which these conditions are changing. Historically, the climate changed over hundreds of thousands, or millions of years, leaving ample time for ecosystems to adapt. In our current case, we are seeing a significant acceleration in conditions over the course of only two centuries. This is almost instantaneous in geological terms, leaving little time for nature to adjust. Similar rapid change in the past has led to extreme ecosystem stress and even extinction events. Therefore, this current transition will likely be more volatile than those seen in the past, with a higher frequency and magnitude of extreme changes and detrimental effects on the Earth’s ecosystems.
Physical Impact #1: Extreme Weather
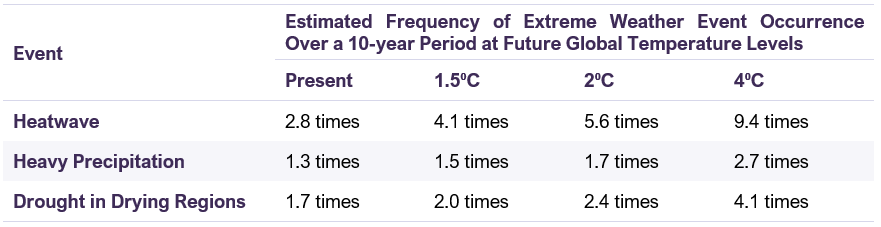
Climate modeling gives a sense of the possible physical changes and the frequency and intensity of extreme climate phenomenon as global average temperatures increase. We highlight some of the modelled results (Table 4, Table 5, and Table 6) but this is by no means an exhaustive list. Note that climate change model results always come in a range, and the table shows best estimates for illustrative purposes.
Estimated Frequency of Extreme Weather Events
Estimated Intensity Increase of Extreme Weather Events
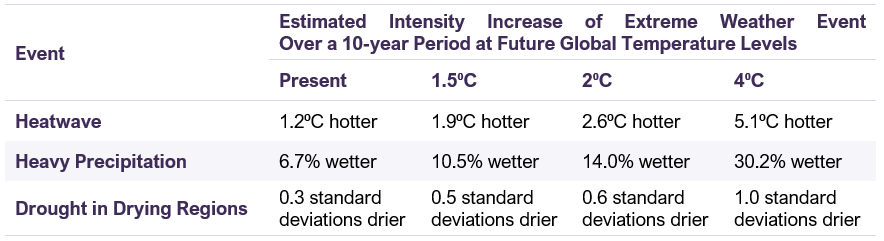
While the effects of a 4⁰C world seems dire, we do not expect temperatures to reach those levels as they would correspond to a scenario similar to SSP5, described earlier. However, the impact of events at 2⁰C, and even 1.5⁰C, are still cause for concern and we believe are likely possible in our base case outlook.
Heatwaves can lead to increased wildfires, stressed marine and land ecosystems, and human health risks. Increased frequency of heavy precipitation would mean greater flood risk, landslide and mudslide hazards, and proliferation of waterborne disease carriers. Drought would lead to stressed crops, water supply concerns, and ecosystem stress. All of which could lead to human migration patterns, concerns over food and water security, risks to infrastructure and potential for ecosystem collapse.
Estimated Climate Change Impact by 2100
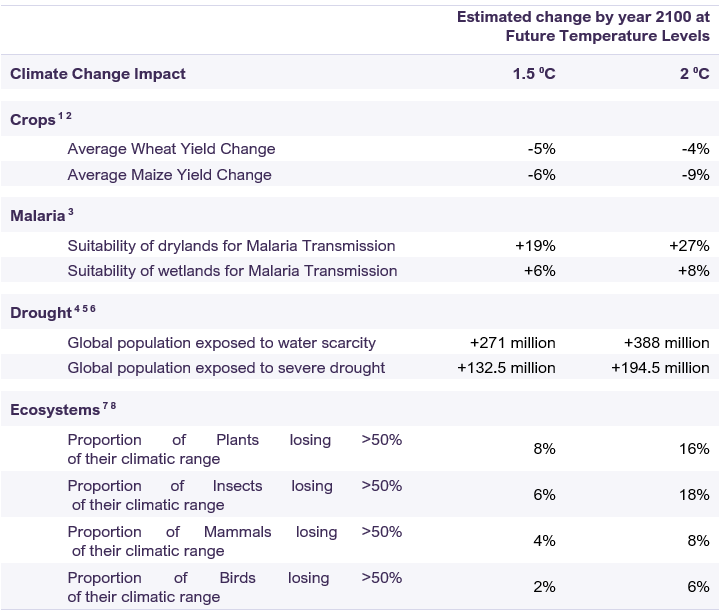
2 – Aerenson, T. et al. (2018) Changes in a suite of indicators of extreme temperature and precipitation under 1.5 and 2 degrees warming, Environmental Research Letters. Data provided by Claudia Tebaldi of the National Center for Atmospheric Research.
3 – Huang, J. et al. (2017) Drylands face potential threat under 2C global warming target, Nature Climate Change. Data provided by Jianping Huang of Lanzhou University
4 – Naumann, G. et al. (2018) Global Changes in Drought Conditions Under Different Levels of Warming, Geophysical Research Letters
5 – Liu, W. et al. (2018) Global Freshwater availability below normal conditions and population impact under 1.5C and 2C stabilization scenarios, Geophysical Research Letters
6- Liu, W. et al. (2018) Global drought and severe drought-Affected populations in 1.5 and 2C warmer worlds, Earth System Dynamics
7 – Warren, R. et al. (2018) The projected effect on insects, vertebrates, and plants of limiting global warming to 1.5C rather than 2C, Science
8 – Huang, J. et al. (2017) Drylands face potential threat under 2C global warming target, Nature Climate Change. Data provided by Jianping Huang of Lanzhou University
Extreme weather events can severely impact ecosystems, populations and regional economies if not properly prepared for. To a degree, we believe adaptation to these conditions is possible through solutions such as drought resistant crops, building of water control and supply infrastructure, improvements in healthcare, and relocation or migration of communities to less affected areas. But as described earlier, these events are likely to be volatile and their increased probability of occurrence must be integrated into our investment analysis.
Physical Impact #2: Sea Level Changes
Increasing temperatures and occurrences of extreme weather events will not be uniform across the globe. Temperature increases on land will generally be more than in the ocean. Geographies closer to the poles will see above average temperature increases due to a process known as Arctic Amplification, whereby melting of reflective sea ice reveals less reflective ocean and land below, which absorbs heat more readily and leads to further warming. The Arctic region is estimated to see approximately double the global average increase, suggesting an accelerated melting of ice sheets, snow cover and permafrost. Melting of land-based ice sheets, from areas such as Greenland and Antarctica, are likely to drive a rise in global mean sea levels over the next century. The pace and magnitude of global sea level rise will vary by SSP (Figure 6), with higher temperatures hastening the process.
Global Mean Sea Level Change Relative to 1900
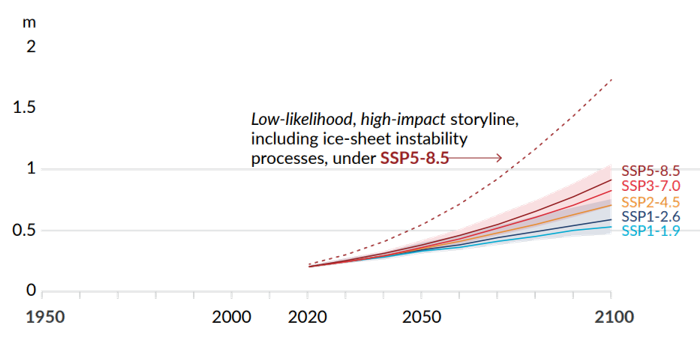
The inertia of sea level rise is expected to continue for thousands of years and is difficult to reverse. In a 2-degree warming scenario, global mean sea level is estimated to rise between two and six meters over the next two millennia. If fossil fuel use proliferates, as described in an SSP5 scenario, sea levels are estimated to reach 19 to 22 meters over the same period. This is equivalent to the height of a 5-story building. Inevitably, this would have meaningful influence on global coast lines.
That being said, sea level rise is a comparatively slow process. It takes centuries to fully play out, allowing some regions to adapt over time through relocation or infrastructure solutions. However, the effects on small island nations and the increased storm surge levels on coastal regions will be felt more acutely. If nothing is done to adapt to rising sea levels, it is estimated that annual flood damages could reach $11.7 Trillion by 2100 in a 2-degree warming scenario[viii]. Construction of flood protection infrastructure and relocation of coastal populations will likely occur over the next half century to mitigate this impact. Longer term, multiple generations will see increased coastal weather volatility and shifting of global coastlines, and we believe these factors need to become an integral part of long-term risk assessment for companies with operations in coastal regions.
The ocean plays key roles in global weather systems, supporting marine life, and the Earth’s carbon cycle. The ocean is estimated to have absorbed between 30% and 50% of CO2 emissions since the pre-industrial era. But increasing CO2 absorption makes the ocean more acidic, impacting sea life, particularly those reliant on carbonate biostructures, such shellfish and coral. In addition, higher water temperatures also cause deoxygenation, meaning there is less oxygen in the water to sustain marine life. Warmer ocean temperature also makes it a less-effective carbon sink, leaving more CO2 in the atmosphere and further accelerating the Greenhouse effect. These effects are likely outside of our ability for adaptation and only by mitigating emissions can we slow or avoid them.
The challenge seems daunting, but we believe there are solutions to the problem. Authors of the AR6 report are optimistic, arguing it is not too late. They suggest that near-term emissions cuts are an important step, and that “the [AR6] report really does show, scientifically and robustly, that Net-Zero does work for stabilizing or even reducing surface temperatures”[ix].
The Solution – A Drive Towards Net-Zero
Key Takeaways
- Global awareness and commitments to reducing emissions are gaining momentum.
- Net-zero requires reducing emissions from all human activities where possible and using carbon removal techniques to offset the balance. This would require nothing short of a fundamental reorganization of essential global industries.
- There is no single pathway towards net-zero and no blanket solution for all emissions.
- The Net-Zero Research Series will analyze the potential pathways to net-zero and, highlight the challenges and opportunities that might be encountered along the way.
The Growing International Response
The climate around “Climate Change” is also changing. The world is recognizing the problem, creating solutions, and momentum towards net-zero is building. In 2015, 196 parties committed to the legally binding Paris Agreement where they pledged to limit global warming to well below 2 degrees, preferably to 1.5 degrees Celsius, compared to pre-industrial levels. Dozens of policies have been introduced to limit the use of fossil fuels and transition towards low-carbon economies and the international community continues to work towards solutions. The recent COP26 (Conference of the Parties 26) attended by representatives and Parties of the United Nations Framework Convention on Climate Change resulted in the Glasgow Climate Pact. This agreement requests that countries revisit their climate pledges by the end of 2022, with calls to strengthen policy, phase down the use of coal and improve levels of financing for tackling climate change.
Corporations are setting their own carbon emission targets and pledges for achieving net-zero emissions in the coming decades. According to surveys conducted by The Energy & Climate Intelligence Unit and Oxford University, 21% of the largest 2000 companies globally have committed to net-zero by 2050. The surveys also show that pledges for net-zero by 2050 have been made by countries and corporations that account for 61% of global GHG emissions, cover 60% of global GDP (PPP) and 56% of the global population. While many of these pledges are in discussion or development phase and have not been enshrined into law, a recognition of the problem and a commitment to a solution represents important progress.
Understanding Net-Zero
With so many organizations, governments and corporations pledging to reach net-zero, it is essential that we know exactly what this means. It goes without saying we support global efforts towards a lower-emission world. But one of the primary goals of this series is to understand the implications of making a net-zero pledge. What does it mean in practice? What will it take to get there? And how do we, as investors, navigate the challenges and opportunities of the transition? A net-zero emissions world does not imply zero emissions. In practice, achieving net-zero means first reducing emissions where possible, and second, offsetting the balance with carbon removal techniques.
Reducing emissions will need to occur in three ways:
- Replace any energy and heat generation process with low-emission or zero-emission sources
- Replace, or retrofit, all industrial, agricultural, transportation and manufacturing processes with low or zero- emission alternatives
- Reduce leakage of captured GHGs, such as methane, where possible
This would require a fundamental transformation in the way we conduct our daily lives and how global industries will function. The technological requirements, infrastructure, and economic conditions required will vary considerably across sectors and geographies. All the underlying processes of each of the sources of emissions discussed earlier (Table 1) would need to change or be rebuilt, and the interconnected nature of these sources cannot be overlooked. As an example, the transition from vehicles using internal combustion engines (ICEs) to electric vehicles (EVs) is a shift we see happening today. This reduces the direct emissions from operating the vehicle. But to truly contribute towards net-zero, the electricity source that charges the EV will also need to be low, or zero, emission. In addition, the natural resource extraction, manufacturing processes, and supply chain to get the EV to market will also need to transition to low, or zero, emissions. This is much more complex than a simple swap of one vehicle for another and will require the reconfiguration of entire global industries to accomplish. This is likely to take considerable time and resources. McKinsey estimates that it will cost $275 Trillion[x], the equivalent of 3 times the entire Global GDP in 2019, to achieve the goal of net-zero by 2050. From an investment point of view, sector-level expertise will be essential for understanding the ability to transition, and which areas will meet distinct challenges or present meaningful opportunities.
The second part of achieving net-zero is to offset remaining emissions with carbon removal techniques, which would include Afforestation and Carbon Capture, Utilization and Storage (CCUS) capabilities. The scale that these techniques will need to be deployed will largely depend on the ability to reduce emissions in the first place.
Afforestation involves planting new trees that will pull CO2 from the atmosphere and convert it into biomass stock. Significant debate around the long-term viability of forests as a store of carbon continues within the scientific community. But there are promising studies that indicate Afforestation as an inexpensive and low-tech technique for removing carbon from the atmosphere.
CCUS, at a high-level, involves capturing the emissions, either at the source or directly from the air, and transporting it to reservoirs where they can be stored indefinitely. These reservoirs are likely to be underground geological formations, such as deep saline aquifers or basaltic rock, where the CO2 transforms into a mineral state and remains inert. This method is still in the nascent stage of commercial applications, especially to the scale that what would be required for a global net-zero target, which according to McKinsey and IEA estimates, could be in the order of 5 to 10 billion tonnes of CO2 or more per year. There is considerable investment and research going into this field, as it is seen as necessary for achieving net-zero.
The Many Pathways to Net-Zero
There is no blanket solution to achieving net-zero. Every source of emissions will have its own set of challenges, and the technological landscape will constantly evolve over the coming decades as humanity applies its ingenuity. As investors, it is important to test the viability of every avenue and outcome within reason so that we can identify the biggest opportunities and risks that we will face over this long transition. We continue to believe in the importance of sector-level expertise to understand how this transition could occur in each area of the economy. We also continue to believe that active engagement with companies, stakeholders, and industry associations to understand and encourage plans for a sustainable and just transition is a critical part of the process.
Conclusion
The difficult and incontrovertible reality is that emissions from human activities are driving long-term changes in the Earth’s climate. These changes will likely lead to widespread disruption to the world’s ecosystems to the detriment of human populations by the end of this century. While this sounds dire, there are solutions that can be used to mitigate the effects of climate change and work towards a lower-carbon world.
Driving towards net-zero emissions is an important initiative that has gained considerable momentum. This journey will span the next several decades if we are to blunt the major impacts of climate change. Achieving net-zero is not as easy as making a pledge, there is significant work to be done and the pathways forward are complex and dynamic.
The Net-Zero Series will continue with a deep dive into each of the major sources of emissions. We will leverage the sector expertise of our team to explore the techniques being applied for emissions reduction today, as well as new technologies that are in development. We will identify the feasibility of achieving net-zero in each area and identify major gaps in emissions reduction capabilities. We invite you to join us on this journey as we integrate these insights into our investment analysis and portfolio strategy.
[i] Denchak, M. (2019, July 23). Greenhouse effect 101. NRDC. Retrieved December 2021, from https://www.nrdc.org/stories/greenhouse-effect-101#whatis
[ii] Denchak, M. (2019, July 23). Greenhouse effect 101. NRDC. Retrieved December 2021, from https://www.nrdc.org/stories/greenhouse-effect-101#whatis
[iii] Denchak, M. (2019, July 23). Greenhouse effect 101. NRDC. Retrieved December 2021, from https://www.nrdc.org/stories/greenhouse-effect-101#whatis
[iv] Denchak, M. (2019, July 23). Greenhouse effect 101. NRDC. Retrieved December 2021, from https://www.nrdc.org/stories/greenhouse-effect-101#whatis
[v] Nordhaus, W.D. “Strategies for the Control of Carbon Dioxide.” Cowles Foundation Discussion Papers No. 443, Cowles Foundation for Research in Economics, Yale University, 1977.
[vi] Sussams, L. (2020, May 29). Carbon Budgets explained. Carbon Tracker Initiative. Retrieved December, 2021, from https://carbontracker.org/carbon-budgets-explained/
[vii] IPCC, 2021: Summary for Policymakers. In: Climate Change 2021: The Physical Science Basis. Contribution of Working Group I to the Sixth Assessment Report of the Intergovernmental Panel on Climate Change [Masson-Delmotte, V., P. Zhai, A. Pirani, S. L. Connors, C. Péan, S. Berger, N. Caud, Y. Chen, L. Goldfarb, M. I. Gomis, M. Huang, K. Leitzell, E. Lonnoy, J.B.R. Matthews, T. K. Maycock, T. Waterfield, O. Yelekçi, R. Yu and B. Zhou (eds.)]. Cambridge University Press. In Press.
[viii] Jevrejeva, S. et al. (2018) Flood damage costs under the sea level rise with warming of 1.5C and 2C, Environmental Research Letters.
[ix] IPCC, 2021: Summary for Policymakers. In: Climate Change 2021: The Physical Science Basis. Contribution of Working Group I to the Sixth Assessment Report of the Intergovernmental Panel on Climate Change [Masson-Delmotte, V., P. Zhai, A. Pirani, S. L. Connors, C. Péan, S. Berger, N. Caud, Y. Chen, L. Goldfarb, M. I. Gomis, M. Huang, K. Leitzell, E. Lonnoy, J.B.R. Matthews, T. K. Maycock, T. Waterfield, O. Yelekçi, R. Yu and B. Zhou (eds.)]. Cambridge University Press. In Press.
[x] McKinsey Global Institute, The Net-Zero Transition: What it would cost, what it could bring, January 2022.
Legal notes
The information and opinions expressed herein are provided for informational purposes only, are subject to change and are not intended to provide, and should not be relied upon for, accounting, legal or tax advice or investment recommendations. Unless otherwise indicated, information included herein is presented as of the dates indicated. While the information presented herein is believed to be accurate at the time it is prepared, Letko, Brosseau & Associates Inc. cannot give any assurance that it is accurate, complete and current at all times.
Where the information contained in this presentation has been obtained or derived from third-party sources, the information is from sources believed to be reliable, but the firm has not independently verified such information. No representation or warranty is provided in relation to the accuracy, correctness, completeness or reliability of such information. Any opinions or estimates contained herein constitute our judgment as of this date and are subject to change without notice.
This presentation may contain certain forward-looking statements which reflect our current expectations or forecasts of future events concerning the economy, market changes and trends. Forward-looking statements are inherently subject to, among other things, risks, uncertainties and assumptions regarding currencies, economic growth, current and expected conditions, and other factors that are believed to be appropriate in the circumstances which could cause actual events, results, performance or prospects to differ materially from those expressed in, or implied by, these forward-looking statements. Readers are cautioned not to place undue reliance on these forward-looking statements.
Concerned about your portfolio?
Subscribe to Letko Brosseau’s newsletter and other publications: