 Canada - FR
 U.S. - EN
- The central bank pivot to less restrictive monetary policy increases the likelihood that the global economy is heading toward a soft landing. The IMF anticipates global real GDP growth of 3.2% in 2024.
- Weaker labour market activity will increasingly weigh on U.S. consumer spending. We forecast U.S. real GDP growth in the range of 1.0-2.0% in 2024.
- Accumulated savings should help Canadian households navigate a period of higher unemployment and elevated borrowing costs. Our outlook is for Canadian real GDP to decelerate to 0.5-1.0% in 2024.
- The Eurozone economy narrowly avoided recession in Q1, but prospects remain poor. Lingering inflation risks could limit the scale of ECB rate cuts.
- Due to higher than expected first-quarter growth and ongoing stimulus efforts, the IMF recently revised China’s 2024 real GDP growth forecast upward. Real GDP is projected to expand by 5% in 2024 compared to the previous estimate of 4.6%.
- Emerging markets have fared well given the headwinds presented by softer developed market growth, tight financial conditions, and a strong U.S. dollar. According to the IMF, emerging market real GDP growth should remain stable at 4.2% in 2024.
- Equities have generated strong absolute returns year-to-date due to cooling inflation and improving prospects of central bank rate cuts.
- Given our base case forecast for slower yet still positive global growth, we remain optimistic about the medium- to long-term return opportunities in equities. We continue to maintain a preference toward stocks over bonds and cash.
Summary
The world economy has undergone a significant adjustment following two years of tight monetary policy. Economic growth is subdued by historical standards, labour markets are cooling, and measures of underlying inflation are steadily approaching target levels.
Given substantial progress on the inflation front, the prospect of monetary easing in the second half of 2024 is increasing. Indeed, the U.S. Federal Reserve is guiding toward a 25-basis point interest rate cut later this year, and peer institutions such as the European Central Bank and the Bank of Canada cut rates by a quarter of a percent in June. Elsewhere, many emerging markets began trimming rates in 2023.
While interest rates remain high enough to exert downward pressure on activity and inflation, global financial conditions are improving at the margin. Meanwhile, fiscal policies are less than austere in most regions. With the world economy continuing to exhibit signs of broad-based macroeconomic resilience, we believe the elements for a continued expansion into next year are in place.
Global growth is on a decelerating, but still positive, trajectory. The IMF forecasts global real GDP to advance by 3.2% in 2024.
U.S. economy adjusting to high interest rates
U.S. real GDP expanded by 0.4% quarter-on-quarter in Q1, and 2.9% in year-on-year terms. Nominal consumer expenditures increased 1.2% quarter-on-quarter and imports surged 2.2%, indicating strong domestic demand. In the same period, fiscal policy also made a sizeable contribution to growth as government expenditures rose 1.4%.
The Federal Reserve’s restrictive monetary policy has reigned in labour market pressures over the past several months. In April, job openings fell to the lowest level since February 2021, bringing the ratio of job vacancies to unemployed people back in line with its long-term average of 1.2, where it has since remained. Similarly, the job quits rate – another signal for wage inflation – has trended down to pre-pandemic norms.
Encouragingly, wages have cooled without a notable increase in unemployment. Average hourly earnings increased by 4.1% year-on-year in May, thus tracking ahead of inflation (3.3%). In the same period, the unemployment rate came in at 4%, a historically low level. Job gains averaged 248,000 per month in the five months to May, down from an average of 299,000 last year, but a still-healthy rate of employment creation.
Recent data appears to indicate that the U.S. economy remains quite strong but is going through the necessary adjustments to allow inflation to move lower toward its 2% target with minimal disruption to economic activity. Core inflation (excluding food and energy) has eased by 190 bps in the last twelve months, reaching a more than three-year low of 3.4% in May. Looking ahead, consumers should continue to benefit from real wage growth as inflation trends lower, but softer labour demand points to weaker hiring and a potential rise in unemployment by year-end. Consumer spending – the economy’s main driver – is likely to slow in the coming months.
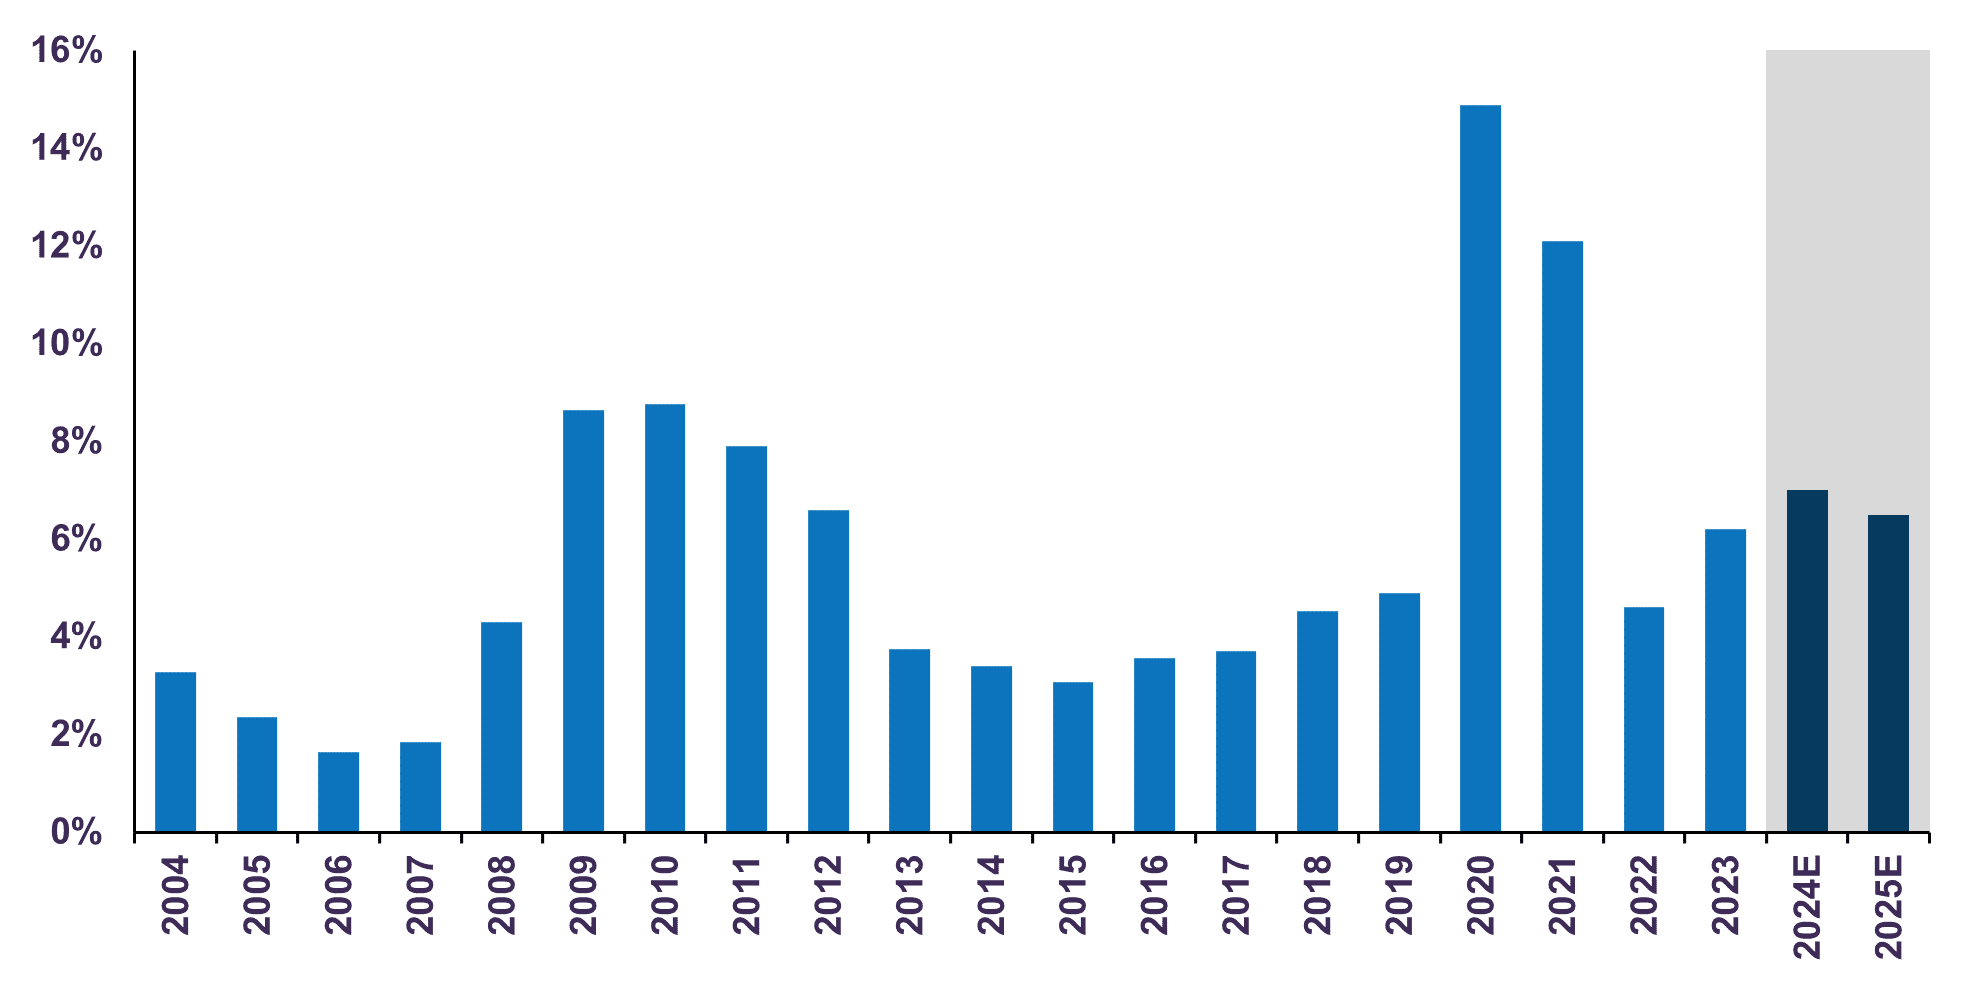
While the fundamentals of private spending are becoming less supportive, public spending should remain robust. Indeed, according to the U.S. Congressional Budget Office, government expenditures are forecast to rise 10.9% this year. In the same period, the federal deficit will be 7% of GDP, well above the 2% average for other advanced economies (Chart 1). This appears remarkably high given the continued strength of the overall economy. Accommodative fiscal policy represents an important offset to the lagged impact of the Federal Reserve’s tight monetary policy.
U.S. Federal Government Deficit
Percentage of GDP
Our base case forecast for the U.S. economy remains unchanged: we expect growth to gradually decelerate and the disinflation process to continue, albeit at a slower rate than in peer economies.
At present, the U.S. boasts the highest rate of growth among G7 nations, and excluding Japan, is the only country in the group yet to cut policy rates. We expect these positive differentials to persist, a clear signal that the U.S. dollar could remain strong through year-end.
We forecast U.S. real GDP will expand by 1.0-2.0% in 2024.
Canada is on a slowing trajectory
In Canada, real GDP advanced 0.4% quarter-on-quarter in Q1. Household expenditures grew 0.7%, underpinned by strong spending on services (+1.1%) relative to goods (+0.3%). Year-over-year, real GDP growth slowed to 0.5% compared to 1.0% in Q4.
Below-trend growth is pushing inflation lower in Canada. Headline inflation decelerated by 50 bps in the five months to May and is now 2.9%. Core inflation has also eased substantially. On a three-month annualized basis – a measure that reflects underlying momentum – core inflation is just 2.3%, only slightly above the Bank of Canada’s 2% target.
Most components of Canada’s CPI show signs of sustained disinflation. As noted in our April Economic and Capital Markets Outlook, housing represents the main source of upward pressure on inflation. In May, shelter inflation increased 6.4% against a year ago. Given its large 28% weight within the CPI basket, this component accounts for more than 60% of overall inflation at present.
While rents have surged alongside strong population growth and low vacancy, higher mortgage interest rates have been the dominant force behind robust shelter inflation in Canada. Mortgages that were initiated between 2020 and early 2022, a period of ultra-low rates, are now renewing at significantly higher levels. In May, mortgage interest costs soared 23.3% year-on-year, adding 90 bps to headline inflation (Table 1). Even with the Bank of Canada’s recent shift to easier policy, shelter costs will continue to put upward pressure on Canadian CPI for some time.
Canadian Inflation
| Category | CPI Weight | %YoY | Impact on Inflation |
| Total | 100% | 2.9% | |
| Core | 77% | 2.9% | |
| Food | 17% | 2.4% | 0.4% |
| Transportation | 16% | 3.5% | 0.6% |
| Shelter | 28% | 6.4% | 1.8% |
| Rent | 7% | 8.6% | 0.6% |
| Owned accommodation | 18% | 6.2% | 1.1% |
| Mortgage interest cost | 4% | 23.3% | 0.9% |
| Other owner costs1 | 14% | 1.6% | 0.2% |
| Utilities | 3% | 2.3% | 0.1% |
| Remaining CPI components2 | 39% | 0.2% | 0.1% |
With the exception of housing, we believe disinflation will be reinforced by weaker labour market dynamics in the coming months. Despite a gain of 26,700 jobs in May, the unemployment rate rose to 6.2% as labour supply continued to outpace hiring activity. The rate of joblessness has steadily edged higher from a near-record low of 5.0% at the beginning of 2023 and is now in-line with pre-pandemic levels.
Rising unemployment confirms the economy is losing momentum. However, Canadian households possess important offsets that should help them manage through a period of weaker economic prospects. The personal savings rate climbed to 6.9% in the first quarter from 6.2% at year-end, a sign that households have continued to stockpile excess savings. With surplus cash of more than C$400 billion, or 14% of GDP, household balance sheets are well-equipped to absorb higher debt service costs and weather labour market headwinds.
The Bank of Canada’s recent decision to begin lowering benchmark interest rates increases the likelihood that the Canadian economy is heading toward a soft landing. We forecast Canadian real GDP growth to slow to a range of 0.5-1.0% in 2024.
Eurozone avoids recession but activity remains stagnant
Eurozone real GDP increased 0.3% in the first three months of 2024, following a 0.1% contraction during the prior quarter. On an annual basis, the economy advanced 0.4% in the first quarter. Despite narrowly avoiding recession, the outlook for the region is challenging.
Households continue to face elevated living costs even as the energy and food price shock triggered by Russia’s invasion of Ukraine has faded. Meanwhile, the lagged impact of the ECB’s sharp hiking cycle is becoming more of a headwind to consumers. Total lending to households contracted through the first four months of 2024.
In contrast, the ECB’s restrictive monetary policy has yet to curtail the Eurozone’s strong labour market. Union-negotiated wages – a measure used to monitor wage inflation pressures – picked up to 4.7% year-on-year in Q1, well above the 3% rate the ECB judges as consistent with target inflation. The unemployment rate remained at a record low of 6.4% in May.
Given the strong link between domestic wage pressures and services inflation, a hot jobs market presents an upside risk to Eurozone inflation and a significant challenge to the ECB’s interest rate cutting cycle. Indeed, service sector prices rose by 4.1% in May, the fastest rate of growth in seven months, while headline inflation recorded its first acceleration since December 2023. Both headline and core inflation remain above the central bank’s 2% target at present. Labour market pressures could limit the scale of additional ECB rate cuts.
In our view, Eurozone economic activity is likely to remain stagnant.
China’s economy advances, backed by monetary and fiscal supports
The Chinese economy recorded a strong start to the year. Real GDP advanced 5.3% in annual terms during the first quarter, the steepest rate of increase since Q2 2023. Industrial output (+6.0%) led growth in the quarter, while service sector activity (+5.0%) also fared well. Since then, economic releases have been mixed.
Manufacturing remains a key area of strength. Industrial production climbed 6.2% year-to-date to May, compared to the same period last year. Investment in manufacturing – an important counterweight to declining real estate investment – surged 9.6% year-on-year in the same period.
China’s property market continues to exert a drag on the economy. Real estate investment fell 10.1% year-on-year in May, extending a period of contraction dating back to 2022. While the property market has shown little sign of recovery to date, we are encouraged by policymakers’ continued efforts to manage the sector’s decline. In May, China’s central bank removed the floor on mortgage interest rates, lowered the required downpayment ratio for homebuyers, and announced RMB 300 billion worth of funding for local governments to buy unsold homes for social housing.
Turning to the household sector, retail sales appear to show Chinese consumers have pared back spending in the last several months. After a 5.5% year-on-year expansion in the January-February period, retail sales decelerated in the following three months to just 3.7% in May. While the situation requires monitoring, the March-May numbers partly reflect the high base of comparison from the prior year when China’s emergence from lockdown provided a temporary boost to spending. Sales growth should firm as this distortion fades in the data. It is worth noting that May marked a sixteenth straight month of positive sales growth.
The IMF recently revised China’s 2024 real GDP growth forecast upwards, citing higher than expected first-quarter growth and ongoing stimulus efforts. Real GDP is projected to expand by 5% on an annual basis in 2024 compared to the previous estimate of 4.6%.
Stable outlook for emerging markets
India’s real GDP rose 7.8% year-on-year in Q1, underpinned by robust private spending and investment. India’s composite PMI recorded a level of 60.9 in June, a strong signal that activity remains in expansionary territory.
India’s 2024 general election secured Prime Minister Modi’s third five-year term but provided him with a weaker mandate. While coalition politics present a more challenging political environment, we expect the government’s broad agenda of investment-led growth to remain intact. India is on track to continue to lead emerging market growth. Real GDP is forecast to increase by 6.8% in 2024, per IMF estimates.
Mexico has benefited from U.S. economic resilience and a growth-oriented fiscal policy. However, there are signs the economy is beginning to lose momentum. In Q1, real GDP expanded by 1.6% against a year ago, the lowest annual growth rate in three years. Mexico’s outlook remains constructive and the IMF projects full-year GDP growth of 2.4% in 2024, though this marks a downward revision from the 2.7% expansion anticipated at the beginning of the year. Elsewhere, Brazil is also expected to see lower growth this year due to the lagged impact of restrictive financial conditions. Real GDP will moderate to 2.2% in 2024 according to the IMF.
Considering that the region has faced weakening developed market growth, relatively tight global financial conditions, and a strong U.S. dollar, it has fared rather well to date. Looking ahead, the prospect of monetary easing by most developed and large emerging market central banks is a positive tailwind. On balance, the IMF expects emerging market real GDP growth to remain stable at 4.2% in 2024.
Stocks rise as inflation cools
Global equities continued to rise in the second quarter, hitting record highs on cooling inflation and improving prospects of global central bank rate cuts. The year-to-date total return of the S&P 500 was 19.6% (in Canadian dollar terms), while the S&P/TSX (6.1%), MSCI ACWI (15.5%), and MSCI Emerging Markets (11.5%) all closed the first half of the year in positive territory.
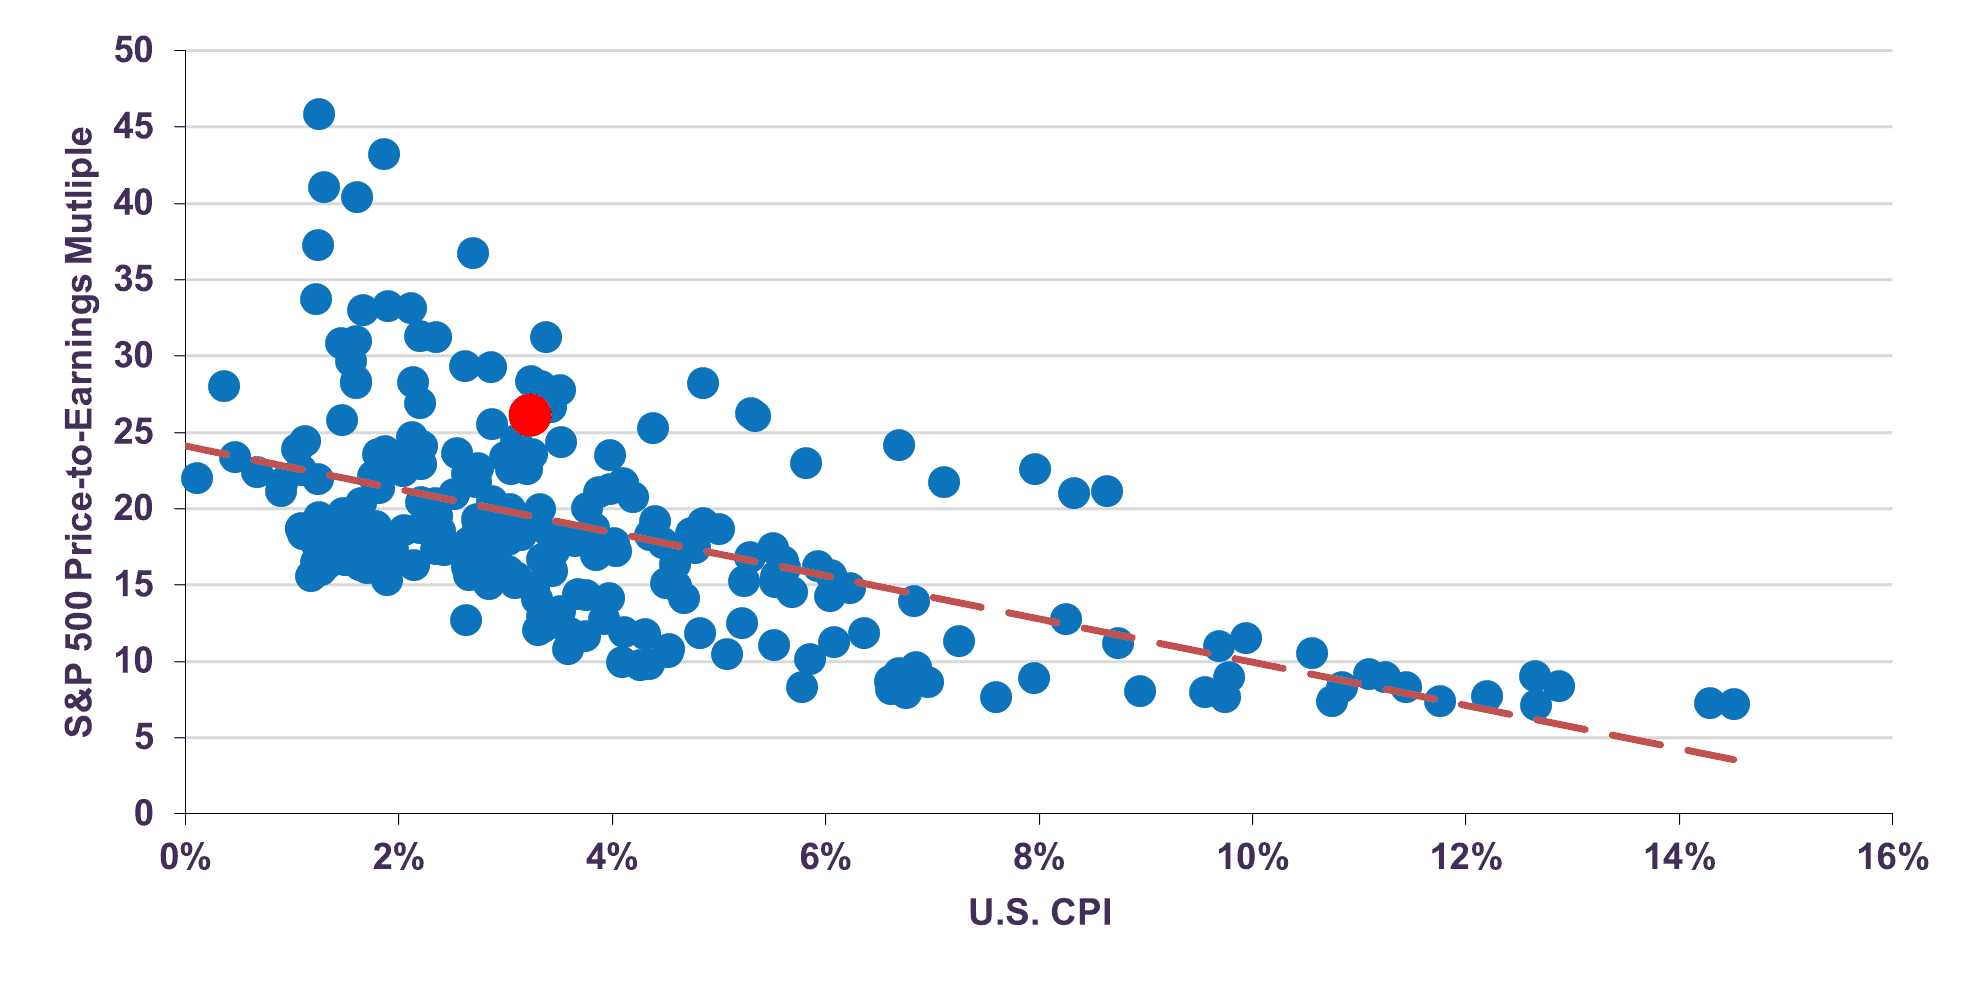
With earnings growth tempered by slower economic activity, much of the rise in U.S. and global stocks to-date has been driven by multiple expansion, raising concerns that the market might be priced for a correction. Indeed, the S&P 500 now trades at 22.9 times 2024 estimated earnings, around 50% above its long-term average of 15 times and up from 19.7 at end-2023. In our assessment, this valuation is broadly consistent with what can be expected based on the well-known relationship between multiples and inflation. Valuations typically rise as inflation falls. Even with signs of exuberance in some sectors, the market is broadly priced in-line with past periods where inflation was around 3% (Chart 2).
The Relationship Between Inflation and P/E Multiples
The outsized role of a small number of expensively valued technology or tech-related companies in index performance has also raised flags about market concentration. The run up of the seven mega-cap companies referred to as the “Magnificent 7” (Apple, Microsoft, Alphabet, Amazon, Nvidia, Meta and Tesla) should warrant a degree of caution from investors. Indeed, the Mag-7 have contributed more than 60% of the S&P 500’s year-to-date gains, account for a remarkable 31% of the index, and trade at an elevated weighted average P/E multiple of 38.8 times.
As we previously highlighted, market valuations are being distorted by the outsized impact of these seven stocks. If we exclude the Mag-7, the S&P 500 would trade at a less elevated 18.9 times 2024 earnings. We believe this differentiated environment – valuations are high in some areas of the market but are not uniformly expensive – is well suited for price-sensitive investors with a longer horizon.
After a strong period of equity market performance, such as the one experienced over the first half of 2024, attempting to time the market ahead of a potential pullback may seem like a tempting strategy. However, as we have underlined in past reports, the process of selling equities and temporarily shifting to cash or fixed income entails two difficult decisions: when to sell and when to re-enter the market. These calls are almost impossible to time perfectly and, most often, expose investors to missing the market’s biggest gains. Remaining invested is crucial to long-term success – timing temporary pullbacks is not.
Turning to fixed income, we do not believe bond prices are attractive enough to warrant a fundamental shift in the asset allocation of our balanced portfolios, even with the potential for fixed income instruments to benefit from lower interest rates. We estimate the fair value of the 10-year Canadian government bond to be around 4-4.5%, compared to its current yield of 3.5%. This suggests longer-dated Canadian bonds are still expensive.
In contrast, the Letko Brosseau global equity portfolio trades at just 12.6 times forward earnings and provides a 3.4% dividend yield. At this juncture, we remain optimistic about the medium- to long-term return opportunities in our equity portfolios and maintain a tilt toward stocks over bonds and cash.
The information and opinions expressed herein are provided for informational purposes only, are subject to change and are not intended to provide, and should not be relied upon for, accounting, legal or tax advice or investment recommendations. Any companies mentioned herein are for illustrative purposes only and are not considered to be a recommendation to buy or sell. It should not be assumed that an investment in these companies was or would be profitable. Unless otherwise indicated, information included herein is presented as of the dates indicated. While the information presented herein is believed to be accurate at the time it is prepared, Letko, Brosseau & Associates Inc. cannot give any assurance that it is accurate, complete and current at all times.
Where the information contained in this presentation has been obtained or derived from third-party sources, the information is from sources believed to be reliable, but the firm has not independently verified such information. No representation or warranty is provided in relation to the accuracy, correctness, completeness or reliability of such information. Any opinions or estimates contained herein constitute our judgment as of this date and are subject to change without notice.
Past performance is not a guarantee of future returns. All investments pose the risk of loss and there is no guarantee that any of the benefits expressed herein will be achieved or realized.
The information provided herein does not constitute investment advice and it should not be relied on as such. It should not be considered a solicitation to buy or an offer to sell a security. It does not take into account any investor’s particular investment objectives, strategies, tax status or investment horizon. There is no representation or warranty as to the current accuracy of, nor liability for, decisions based on such information.
Certain information contained in this document constitutes “forward-looking statements,” which can be identified by the use of forward-looking terminology such as “may,” “will,” “should,” “expect,” “anticipate,” “target,” “project,” “estimate,” “intend,” “continue” or “believe,” or the negatives thereof or other variations thereon or comparable terminology. Due to various risks and uncertainties, actual events or results or the actual performance of the strategy(ies) may differ materially from those reflected or contemplated in such forward-looking statements.
The MSCI information may only be used for your internal use, may not be reproduced or redisseminated in any form and may not be used as a basis for or a component of any financial instruments or products or indices. None of the MSCI information is intended to constitute investment advice or a recommendation to make (or refrain from making) any kind of investment decision and may not be relied on as such. Historical data and analysis should not be taken as an indication or guarantee of any future performance analysis, forecast or prediction. The MSCI information is provided on an “as is” basis and the user of this information assumes the entire risk of any use made of this information. MSCI, each of its affiliates and each other person involved in or related to compiling, computing or creating any MSCI information (collectively, the “MSCI parties”) expressly disclaims all warranties (including, without limitation, any warranties of originality, accuracy, completeness, timeliness, non-infringement, merchantability and fitness for a particular purpose) with respect to this information. Without limiting any of the foregoing, in no event shall any MSCI Party have any liability for any direct, indirect, special, incidental, punitive, consequential (including, without limitation, lost profits) or any other damages. (www.msci.com).
The S&P/TSX Index is a product of S&P Dow Jones Indices LLC or its affiliates (“SPDJI”) and TSX Inc., and has been licensed for use by Letko, Brosseau & Associates Inc. Standard & Poor’s® and S&P® are registered trademarks of Standard & Poor’s Financial Services LLC (“S&P”); Dow Jones® is a registered trademark of Dow Jones Trademark Holdings LLC (“Dow Jones”); and these trademarks have been licensed for use by SPDJI and sublicensed for certain purposes by Letko, Brosseau & Associates Inc. TSX® is a registered trademark of TSX Inc., and have been licensed for use by SPDJI and Letko, Brosseau & Associates Inc. Letko, Brosseau & Associates Inc.’s product is not sponsored, endorsed, sold or promoted by SPDJI, Dow Jones, S&P, their respective affiliates, or Bloomberg and none of such parties make any representation regarding the advisability of investing in such product(s) nor do they have any liability for any errors, omissions, or interruptions of the S&P/TSX Index.
Concerned about your portfolio?
Subscribe to Letko Brosseau’s newsletter and other publications: