 Canada - FR
 U.S. - EN
The global economy proved more resilient than many had anticipated over the past year, defying consensus expectations of a recession and steep rate cuts. Inflation in developed markets moderated, approaching the 2% target, and a significant shift in monetary policy unfolded in 2024, as central banks began moving towards more measured rate cuts.
Against this backdrop, stock markets reached all-time highs, despite occasional volatility, such as the broad-based equity market pull-back in August. Global equity market capitalization rose by 12% over the year, though much of this increase was concentrated among the “Magnificent Seven” (Alphabet, Amazon, Apple, Meta, Microsoft, Nvidia, Tesla), which accounted for over 40% of the $14 trillion rise in total market capitalization. While impressive, it highlights the inherent risk of concentrated gains. We are pleased to note that two of the Magnificent Seven companies—Meta and Alphabet—rank among the top five holdings in our global portfolios and have been significant contributors to our portfolio performance. In addition, the 2024 U.S. election was a notable event, resulting in a Republican-controlled government, with Donald Trump securing the presidency alongside a Republican majority in both the House and Senate.
Looking ahead, we remain cautiously optimistic. The current economic and capital markets environment present compelling opportunities for investors, and we continue to see value in well-diversified portfolios. As we pause and reflect on the highlights of the prior year, we also take this opportunity to share with you our expectations for 2025.
A look back on 2024
Global economic growth in 2024 surpassed consensus expectations. The year began with gloomy projections of sluggish growth and ended on a more resilient note. The IMF revised its global real GDP growth estimate upward to 3.2%, roughly in line with growth from the prior year and well above recessionary levels some forecasters had feared.
Equity markets also outperformed expectations, achieving all-time highs amid strong double-digit returns. The S&P 500 delivered an impressive 36.4% return (total return in Canadian dollars), while the S&P/TSX gained 21.7%, MSCI EAFE 13.2%, MSCI ACWI 28.1%, and MSCI Emerging Markets 17.3%. Fixed income markets adjusted to a rate cutting environment, with the short end of the yield curve dropping around 95 basis points by year-end. In contrast, the Canadian 10-year and 30-year government bond yields closed the year at 3.2% and 3.3% respectively, about 13 and 31 basis points respectively above their 2023 year-end levels.
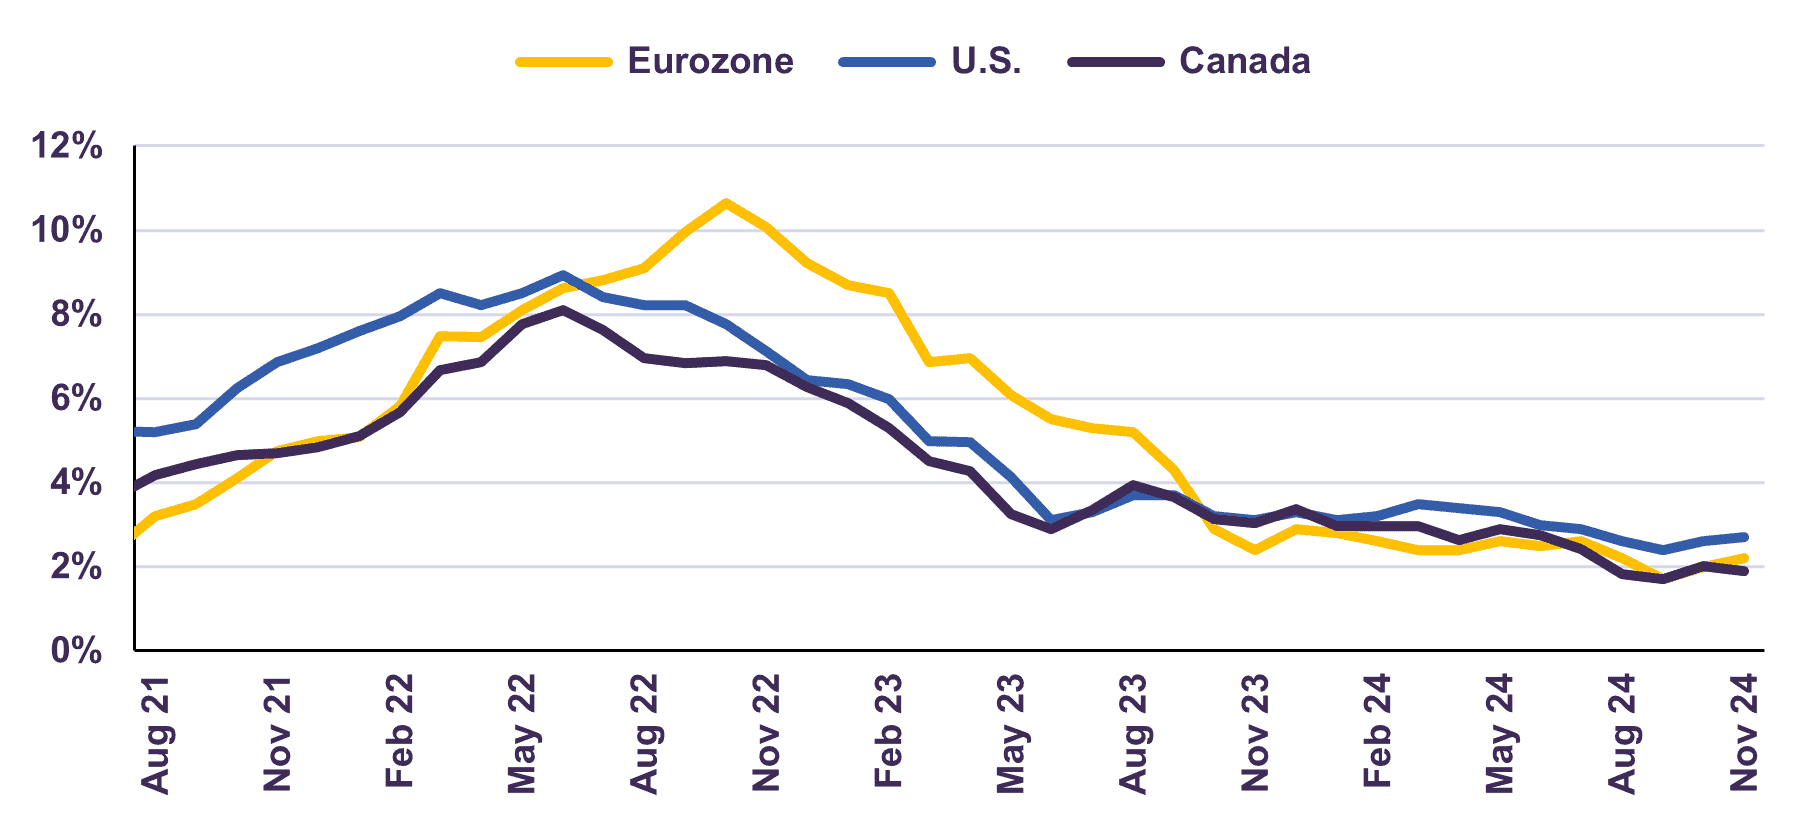
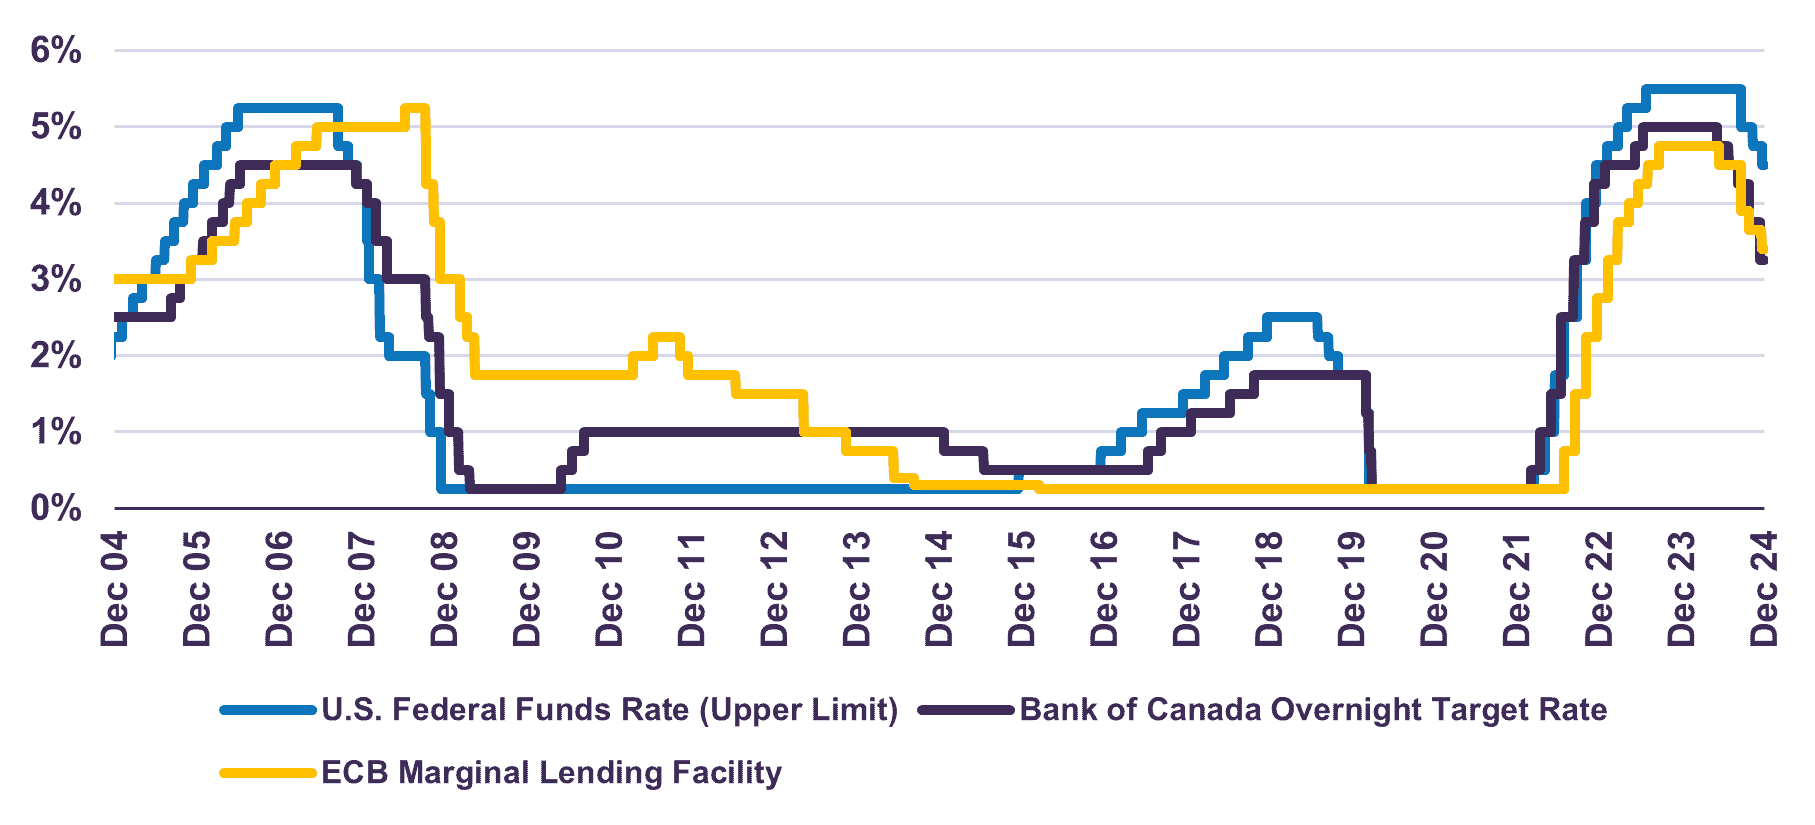
Inflation across the developed world continued to recede towards 2%, driven by the end of COVID-related disruptions and the impact of monetary policy adjustments (Chart 1). As a result, most central banks cut rates throughout the year, shifting to a more accommodative monetary policy stance (Chart 2).
Headline Inflation (% Y/Y)
Central Bank Policy Rates
On the fiscal front, the world’s major economies maintained deficit spending as a support to slowing growth (Table 1). The re-election of Donald Trump, coupled with a Republican sweep of Congress, has set expectations for a pro-growth legislative agenda. However, the specifics of the incoming administration’s policies – particularly on tariffs and trade – and their broader impact remain uncertain, with their full effects likely to unfold over time, should these policies be implemented. We view the prospects of a new trade war as a risk to our base case economic forecast, a subject we cover in more detail in our January 2025 Economic and Capital Markets Outlook.
Deficits as a Share of GDP in World Economies
| Country | Deficits as % of GDP |
| Canada | 2.0% |
| United States | 7.6% |
| Germany | 2.0% |
| United Kingdom | 4.3% |
| France | 6.0% |
| Italy | 4.0% |
| Japan | 6.1% |
| China | 7.4% |
Our investment strategies performed well during the year. The decision to keep a notable overweight position in equities versus fixed income in our balanced portfolios contributed positively to performance. Moreover, the gains in our equity portfolios were diversified across companies and sectors. While the year’s results were impressive, it is worth emphasizing that our portfolios continue to trade at below-average valuation multiples and have the potential for further growth despite the strong returns.
As highlighted in our December Portfolio Update, the strong advance in major equity indices, such as the S&P 500, were disproportionately driven by a small subset of companies. Currently, the ten largest companies in the S&P 500 account for 37% of its market capitalization and collectively trade at a weighted average forward price-to-earnings (P/E) multiple of 33.9x. Moreover, the market capitalization of these top ten companies within the S&P 500 shows the highest level of U.S. equity market concentration since the Dot Com boom in 2000. This level of concentration raises concerns about valuation risks and market euphoria. Recognizing these dynamics, we capitalized on opportunities to realize gains in positions that reached or exceeded our valuation and return targets over the recent months.
Despite pockets of overvaluation, we continue to see significant opportunities for long-term investors. Valuation dispersion within the market has created attractive entry points for companies with strong fundamentals trading at reasonable prices. Our equity portfolio remains well-diversified and is underpinned by structural growth drivers, including technological innovation, demographic shifts and evolving economic trends. Our portfolio trades at a forward P/E of 11.8x, with an estimated compound annual growth rate in earnings per share of 11% from 2024 to 2026, according to external projections1.
Regarding fixed income, in the last couple of years, we lengthened the duration of our portfolios and increased our holdings in high-quality corporate bonds. These strategic changes yielded significant rewards and our fixed income portfolio delivered solid returns in 2024. Our overarching strategy remains unchanged; we are maintaining a lower duration than the index and continue to avoid bonds with a term above ten years. In our view, longer-dated Canadian bonds are still expensive. We estimate the fair value of the 10-year Canadian government bond yield to be around 4-4.5%, compared to its current yield of 3.2%.
2024 Highlights at LetkoBrosseau
At LetkoBrosseau, we remain steadfast in our commitment to providing our clients with timely and informed insights into our portfolio strategies and financial market trends. To this end, we continued to publish our monthly Portfolio Update letters and quarterly Economic and Capital Markets Outlook reports, available in both digital and print formats.
Our commitment to deep, fundamental research was further underscored by over 700 engagements with company management teams and industry experts throughout 2024. These interactions are integral to refining our investment insights and serve as a crucial risk management tool—an advantage often absent in passive investment approaches.
In 2023, we partnered with Navigator, an independent market research and public affairs firm, to survey our clients. Your feedback was instrumental in helping us better understand your needs with a view to improving our services. As an example of your impact, in 2024, we began to upload client statements and LetkoBrosseau tax packages onto our secure online portal. We will be conducting another client survey in the New Year, and we greatly value your continued participation.
Regarding our business initiatives, we continue to progress with the international launch of our emerging markets equity strategy. We strengthened our visibility in the U.S. institutional market through our partnership with Arrow Partners, a New York-based third-party marketing firm. Expanding on this global effort, we partnered last year with Candoris, a Netherlands-based firm, to introduce our EM strategy to European clients. In September, a UCITS fund for global investors outside Canada and the U.S., for which we act as investment manager, was successfully launched, expanding access to our emerging markets equity expertise.

On the governance front, we were pleased to announce the appointment of Jean Gattuso as the next Chair of our Board of Directors, effective January 1, 2025. Mr. Gattuso joined our board in December 2022, bringing exceptional leadership and over 12 years of experience as President and COO of Lassonde Industries, where he played a pivotal role in the company’s expansion across Canada and the U.S. We would like to extend our sincere gratitude to Mr. Thomas Birks, our outgoing Chair, for his exemplary leadership and invaluable contributions to our Board.
A look forward to 2025
As we enter 2025, we maintain our base case forecast of another year of positive, albeit moderate, growth. We anticipate global GDP will rise 3.2% in 2025, unchanged from 2024. Policymakers in much of the developed world continue to signal further rate cuts, which should provide a positive tailwind.
As highlighted in our latest Economic and Capital Markets Outlook, a key risk to our outlook is the potential for renewed trade tensions. The impact of tariffs will vary by country and depend on the scale, timing and implementation, all of which remain to be seen. Moreover, we forecast U.S. real GDP growth to moderate to between 1.0-2.0% in 2025, while Canadian real GDP is expected to grow in the 1.0-2.0% range. Elsewhere, emerging markets are expected to advance by 4.2% in 2025, according to the IMF. On balance, the IMF estimates global real GDP rose 3.2% in 2024, a 0.3% upgrade from their October 2023 forecast and well above recession levels.
We remain committed to our approach of looking beyond short-term forecasts, emphasizing a medium-to long-term focus. As equity markets reached new highs in the fourth quarter and signs of exuberance continue to persist in certain areas of the market, we are carefully navigating this environment and have taken the opportunity to realize gains on several positions that have achieved or exceeded our valuation and return targets. Meanwhile, we exercised discipline in redeploying portfolio capital; our cash reserves have risen somewhat. Our equity holdings, trading at attractive valuations and supported by a 3.5% dividend yield, should provide meaningful value creation over the next 3-5-year horizon. We continue to favour equities over bonds within balanced portfolios and do not advocate any major shifts in asset mix at this time.
On the client services front, we are continuously enhancing our secure client portal to provide greater convenience and accessibility. We encourage clients to transition to digital statements to reduce paper waste and invite those who have not yet activated access to contact their account representative. Additionally, we plan to host a series of webinars in 2025, covering a diverse range of economic and investment topics, designed to keep you informed about our latest insights and perspectives.
Looking ahead, we are exploring the launch of mutual funds for our core investment strategies in 2025, offering clients greater flexibility and accessibility. Furthermore, ChapmanCraig, a multi-family office based in Hong Kong, will launch an Open-ended Fund Company (“OFC”) vehicle for which we will act as investment manager for an equity strategy. This investment vehicle will cater to Asia-based clients and is expected to be available in the coming year.
Since 1988, our investment process has yielded compound returns of 11.4% for all assets under management, compared with 8.4% for the benchmark, and equity returns of 13.3%, outperforming the benchmark of 8.5%2. Over that time, more than $38.3 billion in cumulative gains have been generated for our clients3.
We closed out the year with $17.5 billion in assets under management, an increase from $16.3 billion in 2023. We are proud and honoured to provide our investment services to a multitude of pension plans, foundations and endowments, family offices, corporations and high net worth individuals located around the world. We are confident that our investment approach, which emphasizes companies chosen for their strong business franchises, top management, growth characteristics and sensible valuations, will continue to generate value over the long term.
We thank you for entrusting us with the responsibility of investing on your behalf.
All of us at Letko Brosseau wish you and your families joy, good health and prosperity in the new year.

Daniel Brosseau
PRESIDENT

Peter Letko
SENIOR ADVISOR

David Després
VICE PRESIDENT –
INVESTMENT SERVICES

Stéphane Lebrun
VICE PRESIDENT –
INVESTMENT MANAGEMENT

Rohit Khuller
VICE PRESIDENT –
INVESTMENT MANAGEMENT

Isabelle Godin
VICE PRESIDENT – OPERATIONS AND CFO
2. The performance numbers are annualized and presented in Canadian dollars gross of fees for all assets under management and the equity segment from January 1, 1988 to December 31, 2024 and do not refer to any composite. The benchmark for total assets consists primarily of the FTSE Canada 91 Day T-Bill Total Return Index, FTSE Canada Universe Bond Total Return Index, S&P/TSX Composite Total Return Capped Index and MSCI World Total Return Net Index. The benchmark for all equities consists primarily of the S&P/TSX Composite Total Return Capped Index and MSCI World Total Return Net Index.
3. Represents the net gains on all assets for all mandates under management from January 1, 1988 to December 31, 2024.
The information and opinions expressed herein are provided for informational purposes only, are subject to change and are not intended to provide, and should not be relied upon for, accounting, legal or tax advice or investment recommendations. Any companies mentioned herein are for illustrative purposes only and are not considered to be a recommendation to buy or sell. It should not be assumed that an investment in these companies was or would be profitable. Unless otherwise indicated, information included herein is presented as of the dates indicated. While the information presented herein is believed to be accurate at the time it is prepared, Letko, Brosseau & Associates Inc. cannot give any assurance that it is accurate, complete and current at all times.
Where the information contained in this presentation has been obtained or derived from third-party sources, the information is from sources believed to be reliable, but the firm has not independently verified such information. No representation or warranty is provided in relation to the accuracy, correctness, completeness or reliability of such information. Any opinions or estimates contained herein constitute our judgment as of this date and are subject to change without notice.
The information provided herein does not constitute investment advice and it should not be relied on as such. It should not be considered a solicitation to buy or an offer to sell a security. It does not take into account any investor’s particular investment objectives, strategies, tax status or investment horizon. There is no representation or warranty as to the current accuracy of, nor liability for, decisions based on such information.
Certain information contained in this document constitutes “forward-looking statements,” which can be identified by the use of forward-looking terminology such as “may,” “will,” “should,” “expect,” “anticipate,” “target,” “project,” “estimate,” “intend,” “continue” or “believe,” or the negatives thereof or other variations thereon or comparable terminology. Forward-looking statements are inherently subject to, among other things, risks, uncertainties and assumptions regarding currencies, economic growth, current and expected conditions, and other factors that are believed to be appropriate in the circumstances which could cause actual events, results, performance or prospects to differ materially from those expressed in, or implied by, these forward-looking statements. Readers are cautioned not to place undue reliance on these forward-looking statements.
Past performance is not a guarantee of future returns. All investments pose the risk of loss and there is no guarantee that any of the benefits expressed herein will be achieved or realized.
The MSCI information may only be used for your internal use, may not be reproduced or redisseminated in any form and may not be used as a basis for or a component of any financial instruments or products or indices. None of the MSCI information is intended to constitute investment advice or a recommendation to make (or refrain from making) any kind of investment decision and may not be relied on as such. Historical data and analysis should not be taken as an indication or guarantee of any future performance analysis, forecast or prediction. The MSCI information is provided on an “as is” basis and the user of this information assumes the entire risk of any use made of this information. MSCI, each of its affiliates and each other person involved in or related to compiling, computing or creating any MSCI information (collectively, the “MSCI parties”) expressly disclaims all warranties (including, without limitation, any warranties of originality, accuracy, completeness, timeliness, non-infringement, merchantabiwww.msci.com).
The S&P/TSX Index is a product of S&P Dow Jones Indices LLC or its affiliates (“SPDJI”) and TSX Inc., and has been licensed for use by Letko, Brosseau & Associates Inc. Standard & Poor’s® and S&P® are registered trademarks of Standard & Poor’s Financial Services LLC (“S&P”); Dow Jones® is a registered trademark of Dow Jones Trademark Holdings LLC (“Dow Jones”); and these trademarks have been licensed for use by SPDJI and sublicensed for certain purposes by Letko, Brosseau & Associates Inc. TSX® is a registered trademark of TSX Inc., and have been licensed for use by SPDJI and Letko, Brosseau & Associates Inc. Letko, Brosseau & Associates Inc.’s product is not sponsored, endorsed, sold or promoted by SPDJI, Dow Jones, S&P, their respective affiliates, or Bloomberg and none of such parties make any representation regarding the advisability of investing in such product(s) nor do they have any liability for any errors, omissions, or interruptions of the S&P/TSX Index.
Concerned about your portfolio?
Subscribe to Letko Brosseau’s newsletter and other publications: