 Canada - FR
 U.S. - EN
Global equity markets continued their upward trajectory following the U.S. election, reaching record highs. As of November 30th, the year-to-date total return for the S&P 500 was 36.0% (in Canadian dollars), while the S&P/TSX rose 25.8%, the MSCI ACWI 27.8%, the MSCI EAFE 12.8%, and the MSCI Emerging Markets 14.3%. Investor sentiment surrounding the incoming administration’s pro-growth agenda—including proposed tax cuts and deregulation—has continued to drive market gains. However, the prospect of new tariffs could present a headwind to growth or disrupt progress on the inflation front. The ultimate impact will depend on the scale, timing and implementation of these policies, which remain to be seen.
Navigating Market Concentration and Elevated Valuations
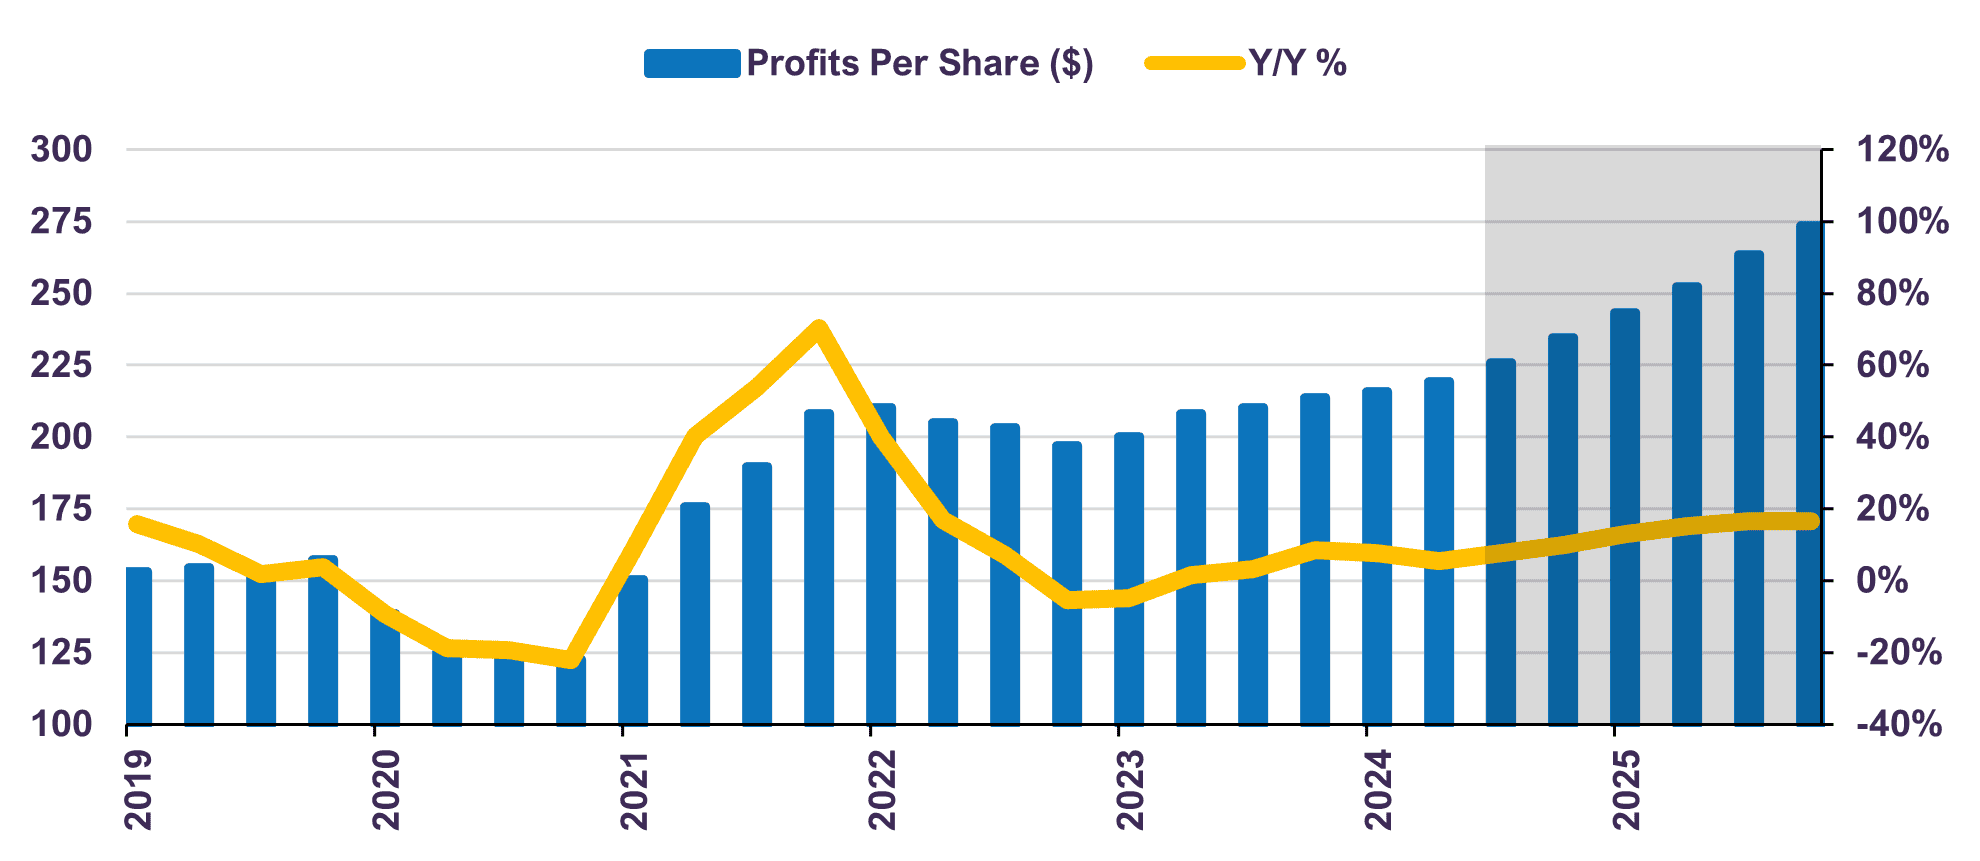
Expectations for corporate earnings in the U.S. have risen, supported by stabilizing inflation, continued job creation and personal income growth (Chart 1). However, this optimism has led to elevated valuations in certain broad-based indices such as the S&P 500, reflecting stretched valuation levels. Investor sentiment, rather than underlying fundamentals, appears to be driving much of this momentum, creating pockets of euphoria. The S&P 500’s forward price-to-earnings ratio has risen to 22.2x as of November 30th, a significant premium over its historical average of around 17x[1]. This disparity is particularly evident in sectors such as technology and consumer discretionary, where valuations reflect overly optimistic growth assumptions. In contrast, the S&P 500 equal-weighted index, which assigns an identical weight to each company and is rebalanced quarterly, has remained more stable and currently sits at 17.9x forward earnings.
Profits Per Share - S&P 500
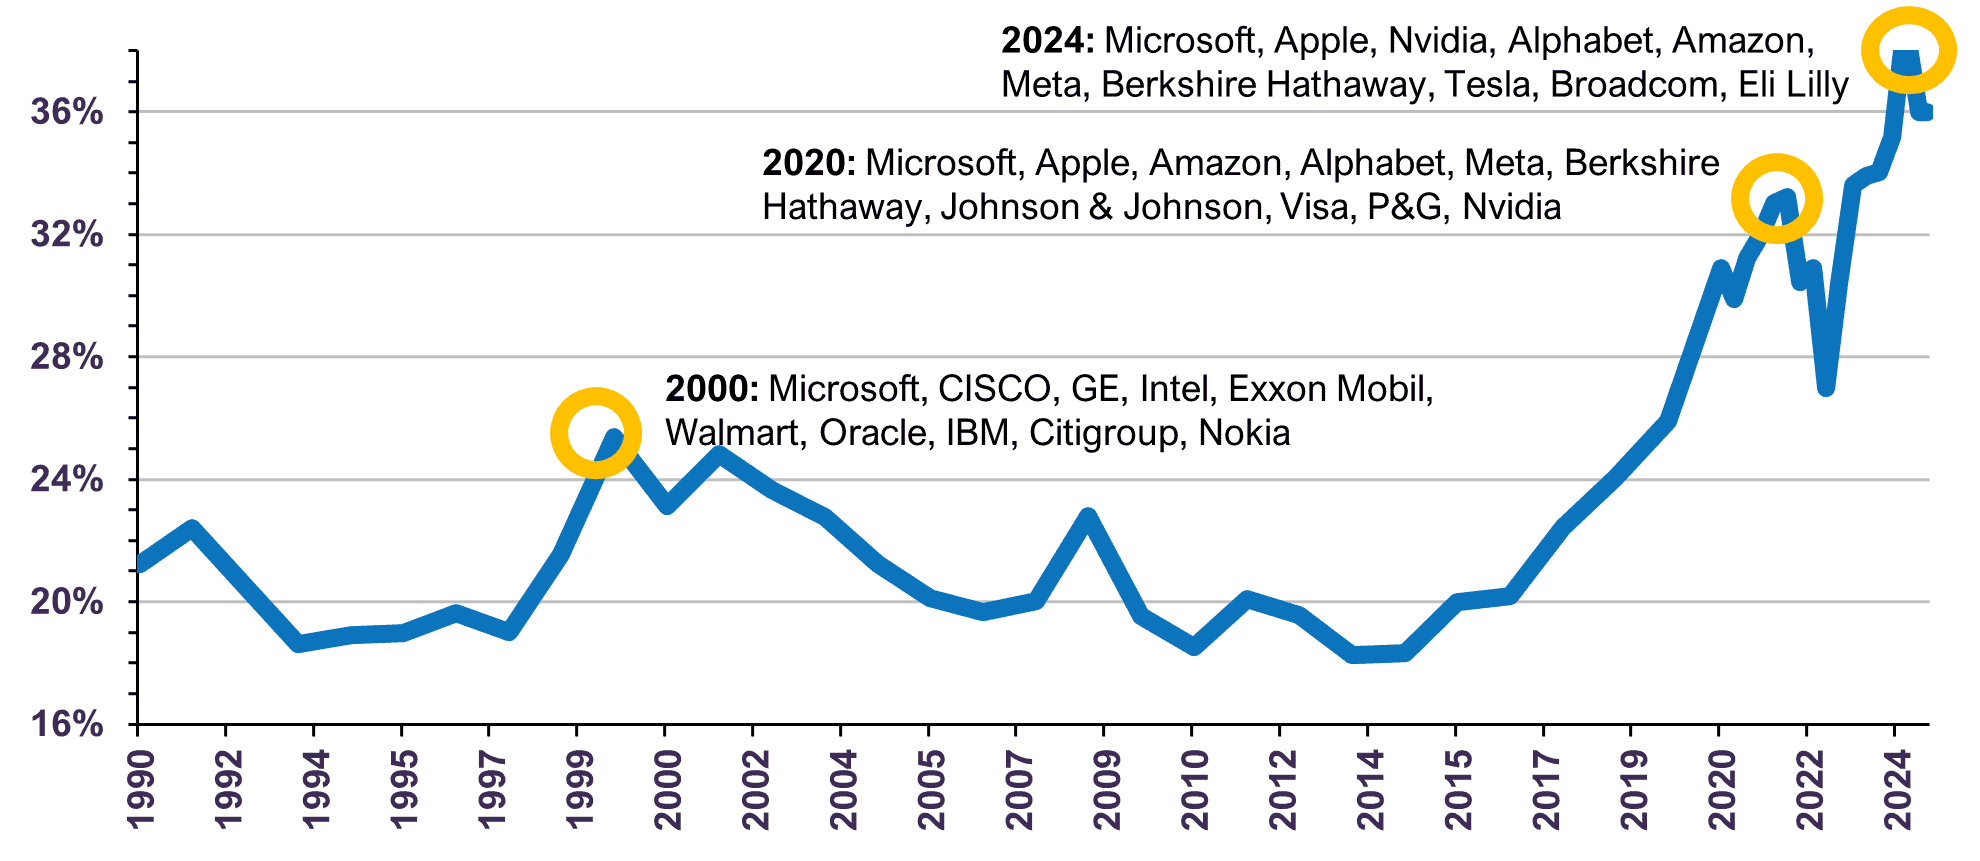
At the same time, U.S. market concentration has reached its highest levels in decades, with a small subset of stocks accounting for a disproportionate share of the S&P 500’s returns. The ten largest companies within the S&P 500 currently account for 36% of its market capitalization and collectively trade at a forward price-to-earnings multiple of 32.9x. Moreover, the market capitalization of these top ten companies within the S&P 500 suggests the highest level of U.S. equity market concentration since the Dot Com boom in 2000 (Chart 2). This heightened concentration increases sensitivity to changes in market sentiment, raising the risk of volatility should expectations fall short.
Top 10 Companies % of S&P 500 Market Cap
High-multiple stocks derive most of their economic value from future earnings forecasts, making them particularly vulnerable to revisions. While forecasting earnings involves inherent uncertainties as company-specific and economy-wide events necessitate a continuous review of our estimates, we mitigate these risks through a disciplined approach focused on companies trading at lower valuations. By prioritizing price sensitivity, we avoid overpaying for earnings that may not materialize. Companies trading at reasonable valuations derive a greater portion of their value from near-term earnings, which have higher visibility and are generally less volatile than earnings forecasted long into the future. The companies held in our portfolios do not depend on near-perfect execution of high-growth projections to justify their market price. In addition, should the economic cycle enter a difficult phase, with earnings growth at risk of being temporarily challenged, we believe our companies can navigate these headwinds more effectively.
Over the recent months, we have taken the opportunity to capitalize on gains from companies that have achieved or exceeded our valuation targets, reallocating capital toward opportunities where the long-term risk-reward profile remains favourable. At this juncture, we are maintaining a tilt to equities within balanced mandates as we believe stocks provide greater longer-term return potential than fixed income securities. Moreover, after a small increase post-election, bond yields have come back down and now sit slightly lower than pre-election levels. Longer-term Treasury yields remain unattractive in relation to our fair value as determined by economic growth and inflation.
Concluding Thoughts
While overly positive investor sentiment may persist in the short-term, our focus remains on creating value over the medium- to long-term. Our equity portfolios are reasonably valued, trading at a forward price-to-earnings multiple of 12.1x, with an expected compound annual growth rate in earnings per share of 12% from 2024 to 2026. Meanwhile, our bond portfolios have a low duration, thereby limiting interest rate risk.
Periods of market euphoria underscore the critical importance of active management, as careful stock and bond selection and a deep understanding of valuation dynamics are essential to navigating heightened risks. By remaining disciplined and selective, we ensure that the investments we own align with both their intrinsic value and the broader objectives of delivering durable, long-term results.
[1] Historical average of S&P 500 forward price-to-earnings date back to the index’s inception of 1957.
Where the information contained in this presentation has been obtained or derived from third-party sources, the information is from sources believed to be reliable, but the firm has not independently verified such information. No representation or warranty is provided in relation to the accuracy, correctness, completeness or reliability of such information. Any opinions or estimates contained herein constitute our judgment as of this date and are subject to change without notice.
Past performance is not a guarantee of future returns. All investments pose the risk of loss and there is no guarantee that any of the benefits expressed herein will be achieved or realized.
The information provided herein does not constitute investment advice and it should not be relied on as such. It should not be considered a solicitation to buy or an offer to sell a security. It does not take into account any investor’s particular investment objectives, strategies, tax status or investment horizon. There is no representation or warranty as to the current accuracy of, nor liability for, decisions based on such information.
Certain information contained in this document constitutes “forward-looking statements,” which can be identified by the use of forward-looking terminology such as “may,” “will,” “should,” “expect,” “anticipate,” “target,” “project,” “estimate,” “intend,” “continue” or “believe,” or the negatives thereof or other variations thereon or comparable terminology. Due to various risks and uncertainties, actual events or results or the actual performance of the strategy(ies) may differ materially from those reflected or contemplated in such forward-looking statements.
The MSCI information may only be used for your internal use, may not be reproduced or redisseminated in any form and may not be used as a basis for or a component of any financial instruments or products or indices. None of the MSCI information is intended to constitute investment advice or a recommendation to make (or refrain from making) any kind of investment decision and may not be relied on as such. Historical data and analysis should not be taken as an indication or guarantee of any future performance analysis, forecast or prediction. The MSCI information is provided on an “as is” basis and the user of this information assumes the entire risk of any use made of this information. MSCI, each of its affiliates and each other person involved in or related to compiling, computing or creating any MSCI information (collectively, the “MSCI parties”) expressly disclaims all warranties (including, without limitation, any warranties of originality, accuracy, completeness, timeliness, non-infringement, merchantability and fitness for a particular purpose) with respect to this information. Without limiting any of the foregoing, in no event shall any MSCI Party have any liability for any direct, indirect, special, incidental, punitive, consequential (including, without limitation, lost profits) or any other damages. (www.msci.com).
The S&P/TSX Index is a product of S&P Dow Jones Indices LLC or its affiliates (“SPDJI”) and TSX Inc., and has been licensed for use by Letko, Brosseau & Associates Inc. Standard & Poor’s® and S&P® are registered trademarks of Standard & Poor’s Financial Services LLC (“S&P”); Dow Jones® is a registered trademark of Dow Jones Trademark Holdings LLC (“Dow Jones”); and these trademarks have been licensed for use by SPDJI and sublicensed for certain purposes by Letko, Brosseau & Associates Inc. TSX® is a registered trademark of TSX Inc., and have been licensed for use by SPDJI and Letko, Brosseau & Associates Inc. Letko, Brosseau & Associates Inc.’s product is not sponsored, endorsed, sold or promoted by SPDJI, Dow Jones, S&P, their respective affiliates, or Bloomberg and none of such parties make any representation regarding the advisability of investing in such product(s) nor do they have any liability for any errors, omissions, or interruptions of the S&P/TSX Index.
Concerned about your portfolio?
Subscribe to Letko Brosseau’s newsletter and other publications: