 Canada - FR
 U.S. - EN
As of the time of writing, the Trump administration initially moved forward with broad-based 25% tariffs on imports from Canada, with Canadian energy facing a lower tariff of 10%. However, three days following the announcement, the administration granted a 30-day exemption on tariffs for Canada and Mexico on products covered under the USMCA, the agreement that replaced NAFTA. Additionally, an extra 10% tariff on Chinese imports—doubling the previously implemented 10%—took effect on March 4th.
In response to the initial tariff announcement, the Canadian government imposed retaliatory tariffs on $155 billion worth of U.S. imports, with the first tranche of tariffs on $30 billion of American goods to be enacted immediately and the remainder set to follow within 21 days as of March 4th.
While some areas of the market had already priced in potential tariff impacts, the announcements immediately triggered declines across major U.S. stock market indices. As of March 7th, year-to-date total returns for the S&P 500 were down by -1.8% (in Canadian dollars), while the S&P/TSX rose by 0.5%, MSCI ACWI 1.3%, the MSCI EAFE 10.5%, and the MSCI Emerging Markets 5.1%. As new measures are proposed and existing policies are revised, industries directly affected—such as aluminum and steel—remain particularly sensitive. Broad market sentiment is likely to remain volatile in the near term as investors assess the full scope of these policy changes.
Offsets to Risk: Mitigating the Economic Impact of Tariffs
We have reviewed our global economic growth forecasts considering these developments. Our forecast for global GDP growth in 2025 is 3.2%, with U.S. and Canadian growth projected at 1-2%, and emerging economies expected to grow at a rate above 4% (Table 1). While this reflects a weaker outlook compared to pre-pandemic periods, we do not anticipate a global recession even with the implementation of tariffs.
Real GDP Growth (% Y/Y)
| 2022 | 2023 | 2024 | 2025 | |
| World | 3.6% | 3.3% | 3.2%* | 3.2%* |
| Advanced Economies | 2.9% | 1.7% | 1.7%* | 1.7%* |
| United-States | 2.5% | 2.9% | 1.5-2.5%* | 1.0-2.0%* |
| Canada | 3.8% | 1.2% | 0.5-1.0%* | 1.0-2.0%* |
| Eurozone | 3.3% | 0.4% | 0-1.0%* | 0.5-1.5%* |
| United-Kingdom | 4.8% | 0.3% | 1.1% | 1.5% |
| Japan | 1.2% | 1.7% | 0.3% | 1.1% |
| Emerging Economies | 4.0% | 4.4% | 4.2% | 4.2% |
| China | 3.0% | 5.2% | 4.8% | 4.5% |
| India | 7.0% | 8.2% | 7.0% | 6.5% |
| Brazil | 3.0% | 2.9% | 3.0% | 2.2% |
| Mexico | 3.7% | 3.2% | 1.5% | 1.3% |
The U.S.-Canada trade relationship remains deeply integrated, with cross-border supply chains built over decades. While tariffs introduce near-term challenges, Canada’s trade surplus with the U.S. is primarily driven by oil and gas, and essential industrial inputs such as auto parts and base metals. This allows U.S. industries to create value-added products. For instance, Canada exports crude oil to the U.S., where it is refined and either consumed domestically or exported. While alternative sources exist, replacing Canadian exports is complex, not only for oil but for other commodities like fertilizers, where the top three suppliers are Canada, Russia, and China. Given these interdependencies, the prolonged use of tariffs remains uncertain.
The Bank of Canada estimates an initial 2.5% drag on GDP in the first year of the implementation of tariffs. However, several economic levers listed below exist to mitigate the potential harm:
1. Fiscal & Monetary Policy Flexibility
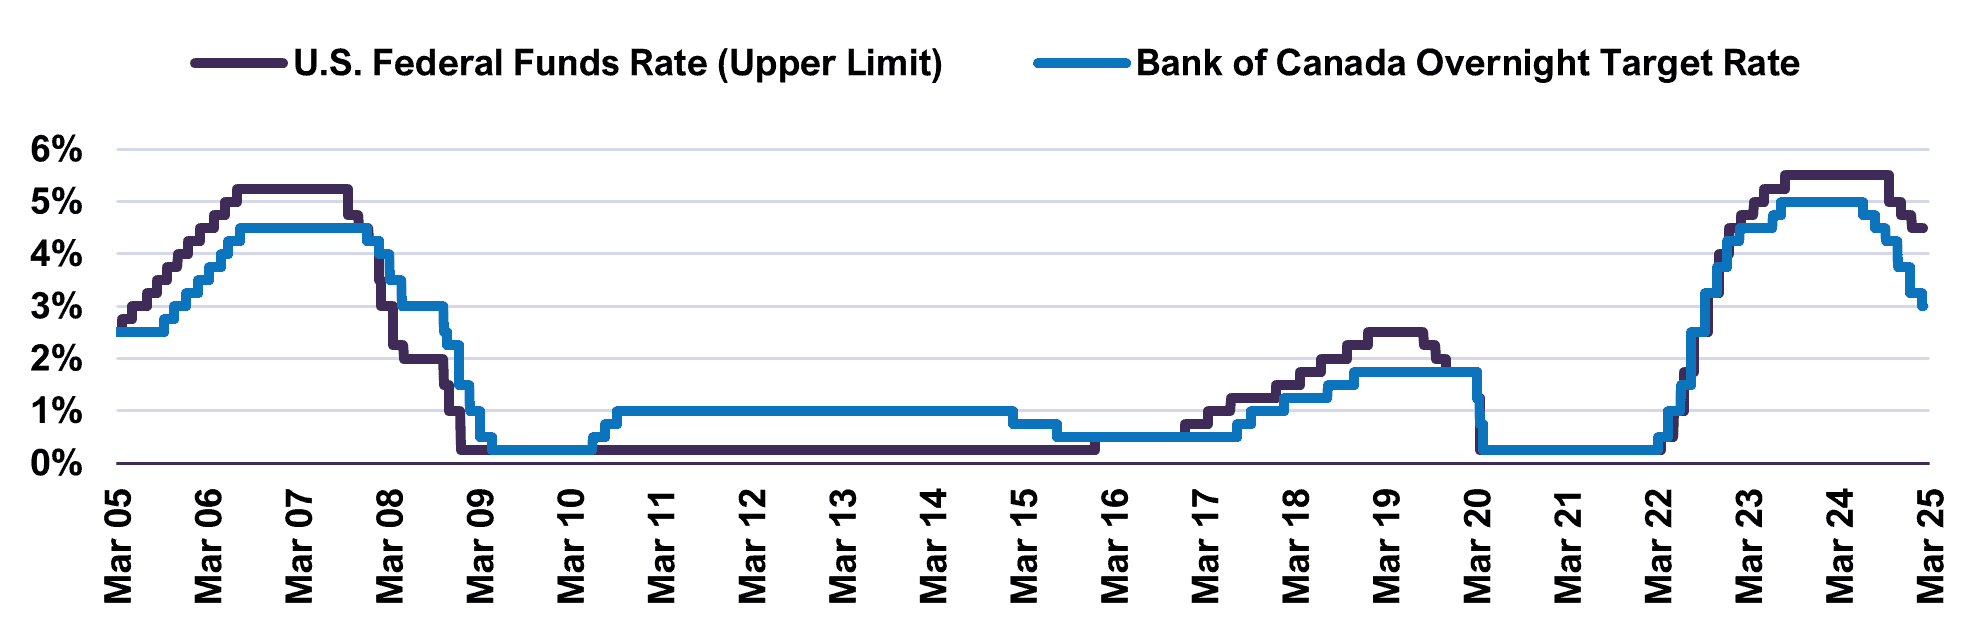
Inflation has moderated to below 2%, and the Bank of Canada maintains policy rates above pre-pandemic levels, offering room for potential rate cuts if economic conditions weaken (Chart 1).
Additionally, Canada’s deficit to GDP remains one of the lowest among developed markets, allowing room for fiscal stimulus if required (Table 2). Increased government spending could counteract the economic impact of tariffs.
Deficits as a Share of GDP in World Economies
| Country | Deficits as % of GDP |
| Canada | 2.0% |
| United States | 7.6% |
| Germany | 2.0% |
| United Kingdom | 4.3% |
| France | 6.0% |
| Italy | 4.0% |
| Japan | 6.1% |
| China | 7.4% |
In the U.S., several pro-growth policies are currently being implemented, with additional measures expected to be introduced in the future as part of an ongoing effort to stimulate economic growth. This includes for example the deregulation of many industries which would provide a boost to investments. Therefore, on both sides of the border, fiscal policy will likely contribute positively to growth in 2025 and onward.
2. Household Resilience
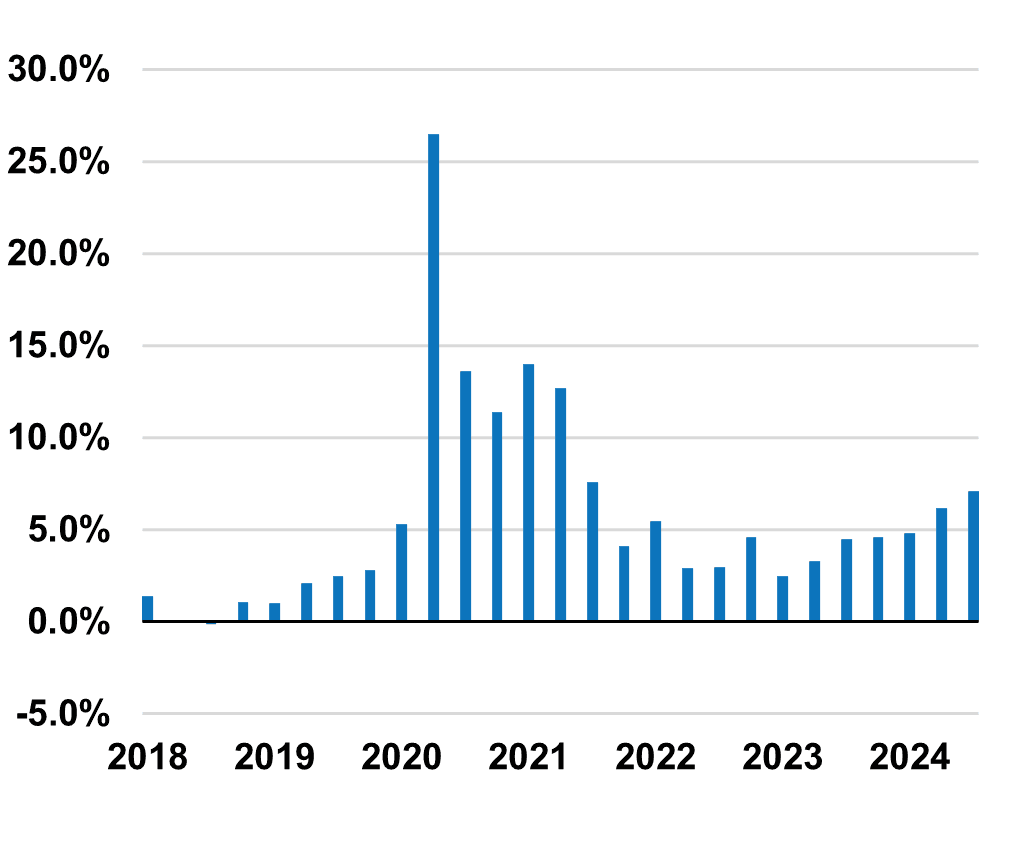
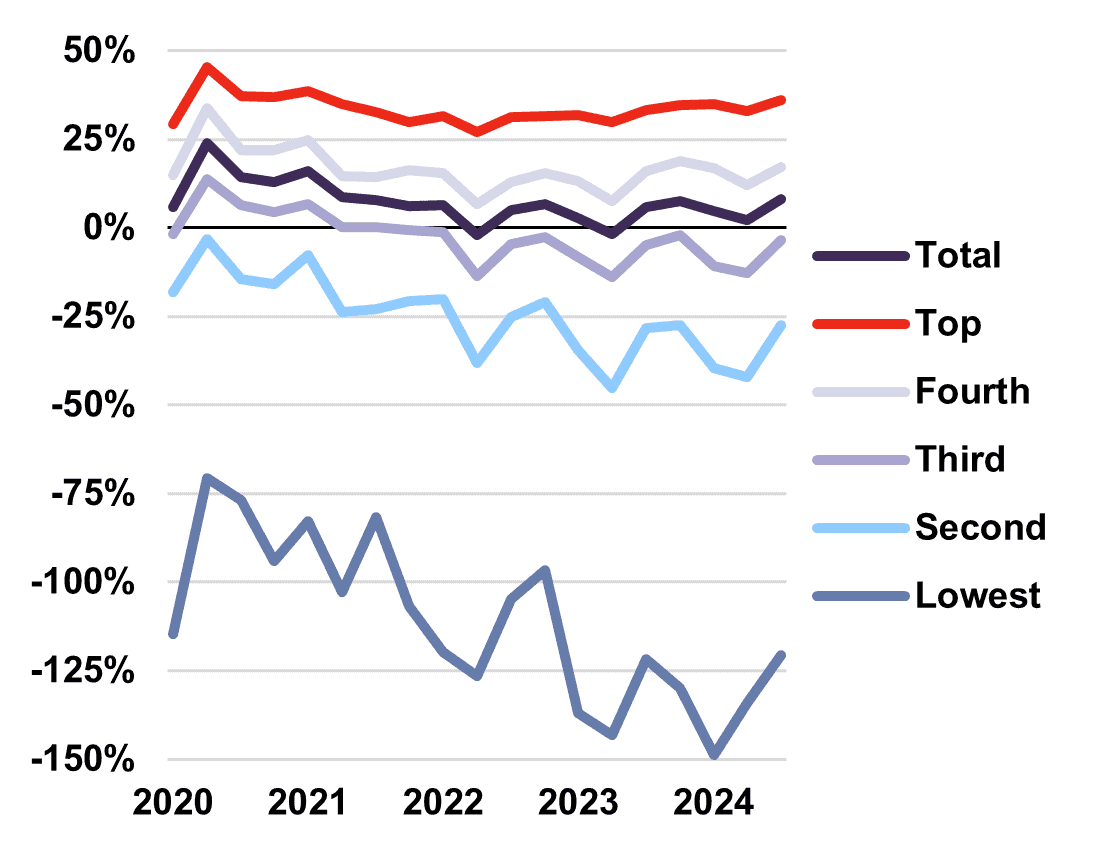
Canadian households remain in a relatively strong financial position, with the savings rate higher than pre-pandemic levels and continuing to rise (Chart 2). However, economic conditions vary across income groups. Decomposing the savings rate by income quintiles highlights that 40% of Canadian households maintain healthy savings and contribute significantly to economic growth through consumption (Chart 3). In contrast, another 40% have negative savings rates, while the remaining quintile maintains a near-zero savings rate, making them more vulnerable to economic shocks. These households are more likely to experience significant financial strain, particularly if the imposition of tariffs leads to rising costs for goods, further burdening their financial situation.
Canada - Personal Savings Rate
Canada - Savings Rate by Quintile
3. Strength of the Banking System
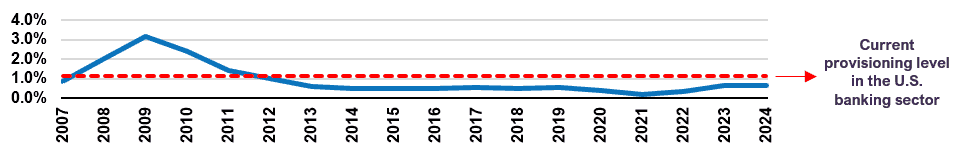
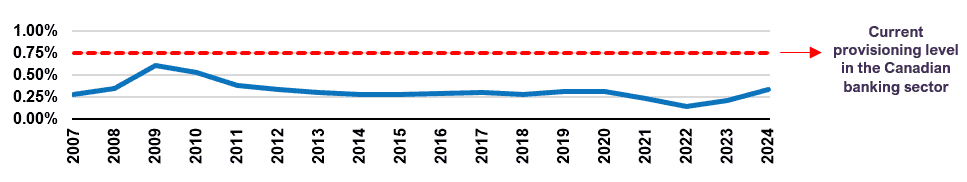
Both Canadian and U.S. banks remain well-capitalized, having increased reserves over the past two years in anticipation of potential downturns (Chart 4 and Chart 5). This positions them to absorb economic shocks and sustain lending activity, mitigating the risk of a credit contraction.
U.S. Bank Loan Losses vs. Reserves
Canadian Bank Loan Losses vs. Reserves
4. The Currency
Currency movements play a crucial role in offsetting trade-related risks. At LetkoBrosseau, we assess the fair value of currencies similar to how we evaluate equities.
Currently, we estimate the Canadian dollar to be 26% undervalued relative to the U.S. dollar—a level of undervaluation last seen in the early 2000s (Chart 6).
U.S. Dollar vs. Canadian Dollar Exchange Rate & Fair Value
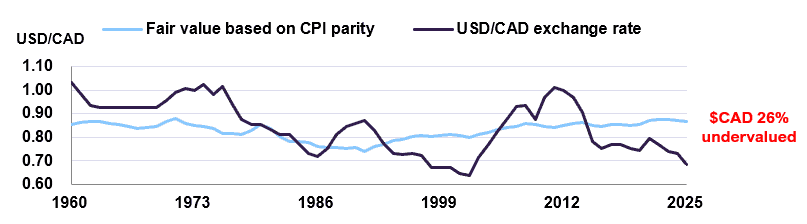
Following that period, the Canadian dollar appreciated from 0.65 to parity against the U.S. dollar by 2008. While history does not necessarily repeat itself, the degree of current undervaluation suggests limited downside for the currency. Moreover, a weaker Canadian dollar enhances export competitiveness, partially offsetting the cost increases associated with tariffs. Industries such as oil and gas, which sell a global commodity priced in U.S. dollars, stand to benefit directly; for every 1% depreciation in the Canadian dollar, the sector experiences an estimated 1% increase in cash flow.
Offsets to Risk: Managing Volatility in Markets
Given ongoing trade uncertainties, we continue to mitigate risks within volatile markets through a disciplined investment approach that emphasizes diversification, prudent portfolio adjustments, and a focus on high-quality businesses. Diversification remains a key strategy to reduce exposure to adverse events that may impact specific industries or regions. By focusing on companies with strong fundamentals across multiple sectors and geographies, we position our portfolios to remain resilient amid market disruptions.
For balanced mandates, we have historically maintained an overweight position in equities. However, we have recently adjusted our allocations to better align with mandated targets by trimming positions in companies that have reached or exceeded their intrinsic valuations. In fully invested equity portfolios, we have also selectively raised a moderate level of cash by exiting or trimming positions where valuations appear stretched. This measured approach provides the flexibility needed to navigate a potentially more turbulent environment and redeploy capital opportunistically as market dislocations arise.
While our portfolio valuations remain well supported by earnings, cash flows, and dividends, broader market valuations are elevated, increasing the likelihood of periodic corrections. We remain focused on ensuring the portfolio is composed of resilient businesses with sustainable valuations, enabling them to weather short-term market volatility and deliver value over the medium-to-long-term.
Concluding Thoughts
While tariff-related risks exist, the combination of resilient banking systems, flexible fiscal and monetary policies, and a dynamic currency environment provides a balanced economic outlook. We maintain a global GDP growth forecast of approximately 3% in 2025, despite potential market volatility and trade tensions. The full impact of tariffs will depend on their scope, potential revisions, and most importantly, their duration, making it difficult at present to accurately predict the long-term effects.
That said, navigating shifting economic and market environments is not new to us. Over the past 37 years, our investment philosophy—rooted in rigorous, bottom-up research—has enabled us to navigate through many periods of volatility. By focusing on high-quality, attractively valued companies, we remain confident that our portfolios are positioned for both sustainable income generation and long-term growth. We will continue to monitor events closely and reassess our views as needed.
Where the information contained in this presentation has been obtained or derived from third-party sources, the information is from sources believed to be reliable, but the firm has not independently verified such information. No representation or warranty is provided in relation to the accuracy, correctness, completeness or reliability of such information. Any opinions or estimates contained herein constitute our judgment as of this date and are subject to change without notice.
Past performance is not a guarantee of future returns. All investments pose the risk of loss and there is no guarantee that any of the benefits expressed herein will be achieved or realized.
The information provided herein does not constitute investment advice and it should not be relied on as such. It should not be considered a solicitation to buy or an offer to sell a security. It does not take into account any investor’s particular investment objectives, strategies, tax status or investment horizon. There is no representation or warranty as to the current accuracy of, nor liability for, decisions based on such information.
Certain information contained in this document constitutes “forward-looking statements,” which can be identified by the use of forward-looking terminology such as “may,” “will,” “should,” “expect,” “anticipate,” “target,” “project,” “estimate,” “intend,” “continue” or “believe,” or the negatives thereof or other variations thereon or comparable terminology. Forward-looking statements are inherently subject to, among other things, risks, uncertainties and assumptions regarding currencies, economic growth, current and expected conditions, and other factors that are believed to be appropriate in the circumstances which could cause actual events, results, performance or prospects to differ materially from those expressed in, or implied by, these forward-looking statements. Readers are cautioned not to place undue reliance on these forward-looking statements.
The MSCI information may only be used for your internal use, may not be reproduced or redisseminated in any form and may not be used as a basis for or a component of any financial instruments or products or indices. None of the MSCI information is intended to constitute investment advice or a recommendation to make (or refrain from making) any kind of investment decision and may not be relied on as such. Historical data and analysis should not be taken as an indication or guarantee of any future performance analysis, forecast or prediction. The MSCI information is provided on an “as is” basis and the user of this information assumes the entire risk of any use made of this information. MSCI, each of its affiliates and each other person involved in or related to compiling, computing or creating any MSCI information (collectively, the “MSCI parties”) expressly disclaims all warranties (including, without limitation, any warranties of originality, accuracy, completeness, timeliness, non-infringement, merchantability and fitness for a particular purpose) with respect to this information. Without limiting any of the foregoing, in no event shall any MSCI Party have any liability for any direct, indirect, special, incidental, punitive, consequential (including, without limitation, lost profits) or any other damages. (www.msci.com).
The S&P/TSX Index is a product of S&P Dow Jones Indices LLC or its affiliates (“SPDJI”) and TSX Inc., and has been licensed for use by Letko, Brosseau & Associates Inc. Standard & Poor’s® and S&P® are registered trademarks of Standard & Poor’s Financial Services LLC (“S&P”); Dow Jones® is a registered trademark of Dow Jones Trademark Holdings LLC (“Dow Jones”); and these trademarks have been licensed for use by SPDJI and sublicensed for certain purposes by Letko, Brosseau & Associates Inc. TSX® is a registered trademark of TSX Inc., and have been licensed for use by SPDJI and Letko, Brosseau & Associates Inc. Letko, Brosseau & Associates Inc.’s product is not sponsored, endorsed, sold or promoted by SPDJI, Dow Jones, S&P, their respective affiliates, or Bloomberg and none of such parties make any representation regarding the advisability of investing in such product(s) nor do they have any liability for any errors, omissions, or interruptions of the S&P/TSX Index.
Concerned about your portfolio?
Subscribe to Letko Brosseau’s newsletter and other publications: