 Canada - FR
 U.S. - EN
Economic and Capital Markets Outlook
July 2021- A new global expansion is underway. The IMF expects the world economy to advance 6.0% in 2021, its fastest pace of growth in decades.
- The U.S. is leading most countries in vaccination progress and reopening. We forecast its economy will expand by 6.4% in 2021.
- Robust trade activity combined with strong housing and non-residential investment is boosting activity in Canada. We expect real GDP to increase by 5.0% in 2021, a 20-year high.
- Recoveries are uneven across the eurozone, but the regional outlook is improving. We forecast real GDP will advance 4.4% in 2021.
- As vaccine rollouts accelerate in the second half of the year, the IMF anticipates emerging market real GDP will expand 6.7% in 2021.
- We view a revival of inflation as confirmation of a strong stimulus-led recovery. A reversal of accommodative monetary and fiscal policies is still some time away in developed markets.
- Global equity markets reached new highs in Q2 on upward revisions to earnings and firming economic momentum. Although some segments of the market seem expensive, equity valuations are not uniformly unreasonable.
- We believe our portfolios are well suited for the current environment and offer considerable potential for value creation over the medium-term. We continue to overweight equities within balanced portfolios while keeping bond duration short and credit quality high.
Summary
The world economy is on course to deliver the strongest year of growth in more than a decade. The current structural backdrop reinforces our optimism that a new cyclical expansion is well underway. Accumulated household savings and policy support continue to boost consumer demand for goods around the world. Manufacturing output and trade activity are surpassing pre-pandemic levels. Meanwhile, the outlook for hospitality, leisure and consumer service sectors is increasingly positive as rapid vaccination progress is allowing the developed world to press on with reopening.
Aggregate global activity is closely following our U-shaped scenario first outlined in the April 2020 Economic and Capital Markets Outlook; gradual improvement in 2020 followed by a sustained upswing in the second half of 2021.
The IMF projects that global real GDP will surge 6.0% in 2021 and 4.4% in 2022.
U.S. leading global expansion
U.S. real GDP grew 1.6% quarter-on-quarter in Q1, the fastest rate of expansion among G7 countries. On a year-on-year basis, real GDP was up 0.4%. Consumer spending rose 3.6% year-on-year in nominal terms, boosted by large-scale immunization and $900 billion worth of additional fiscal support. Household disposable incomes climbed 1.5% in May.
The employment picture is increasingly positive. In the 14 months since April 2020, 18.2 million Americans returned to work and the unemployment rate declined to 5.9% from its pandemic peak of 14.8%. Average hourly earnings grew 3.6% against a year ago in June while weekly hours worked increased 0.3%. Record-high household net worth of $137 trillion and an elevated savings rate of 12.4% bode well for consumer demand in the second half of 2021.
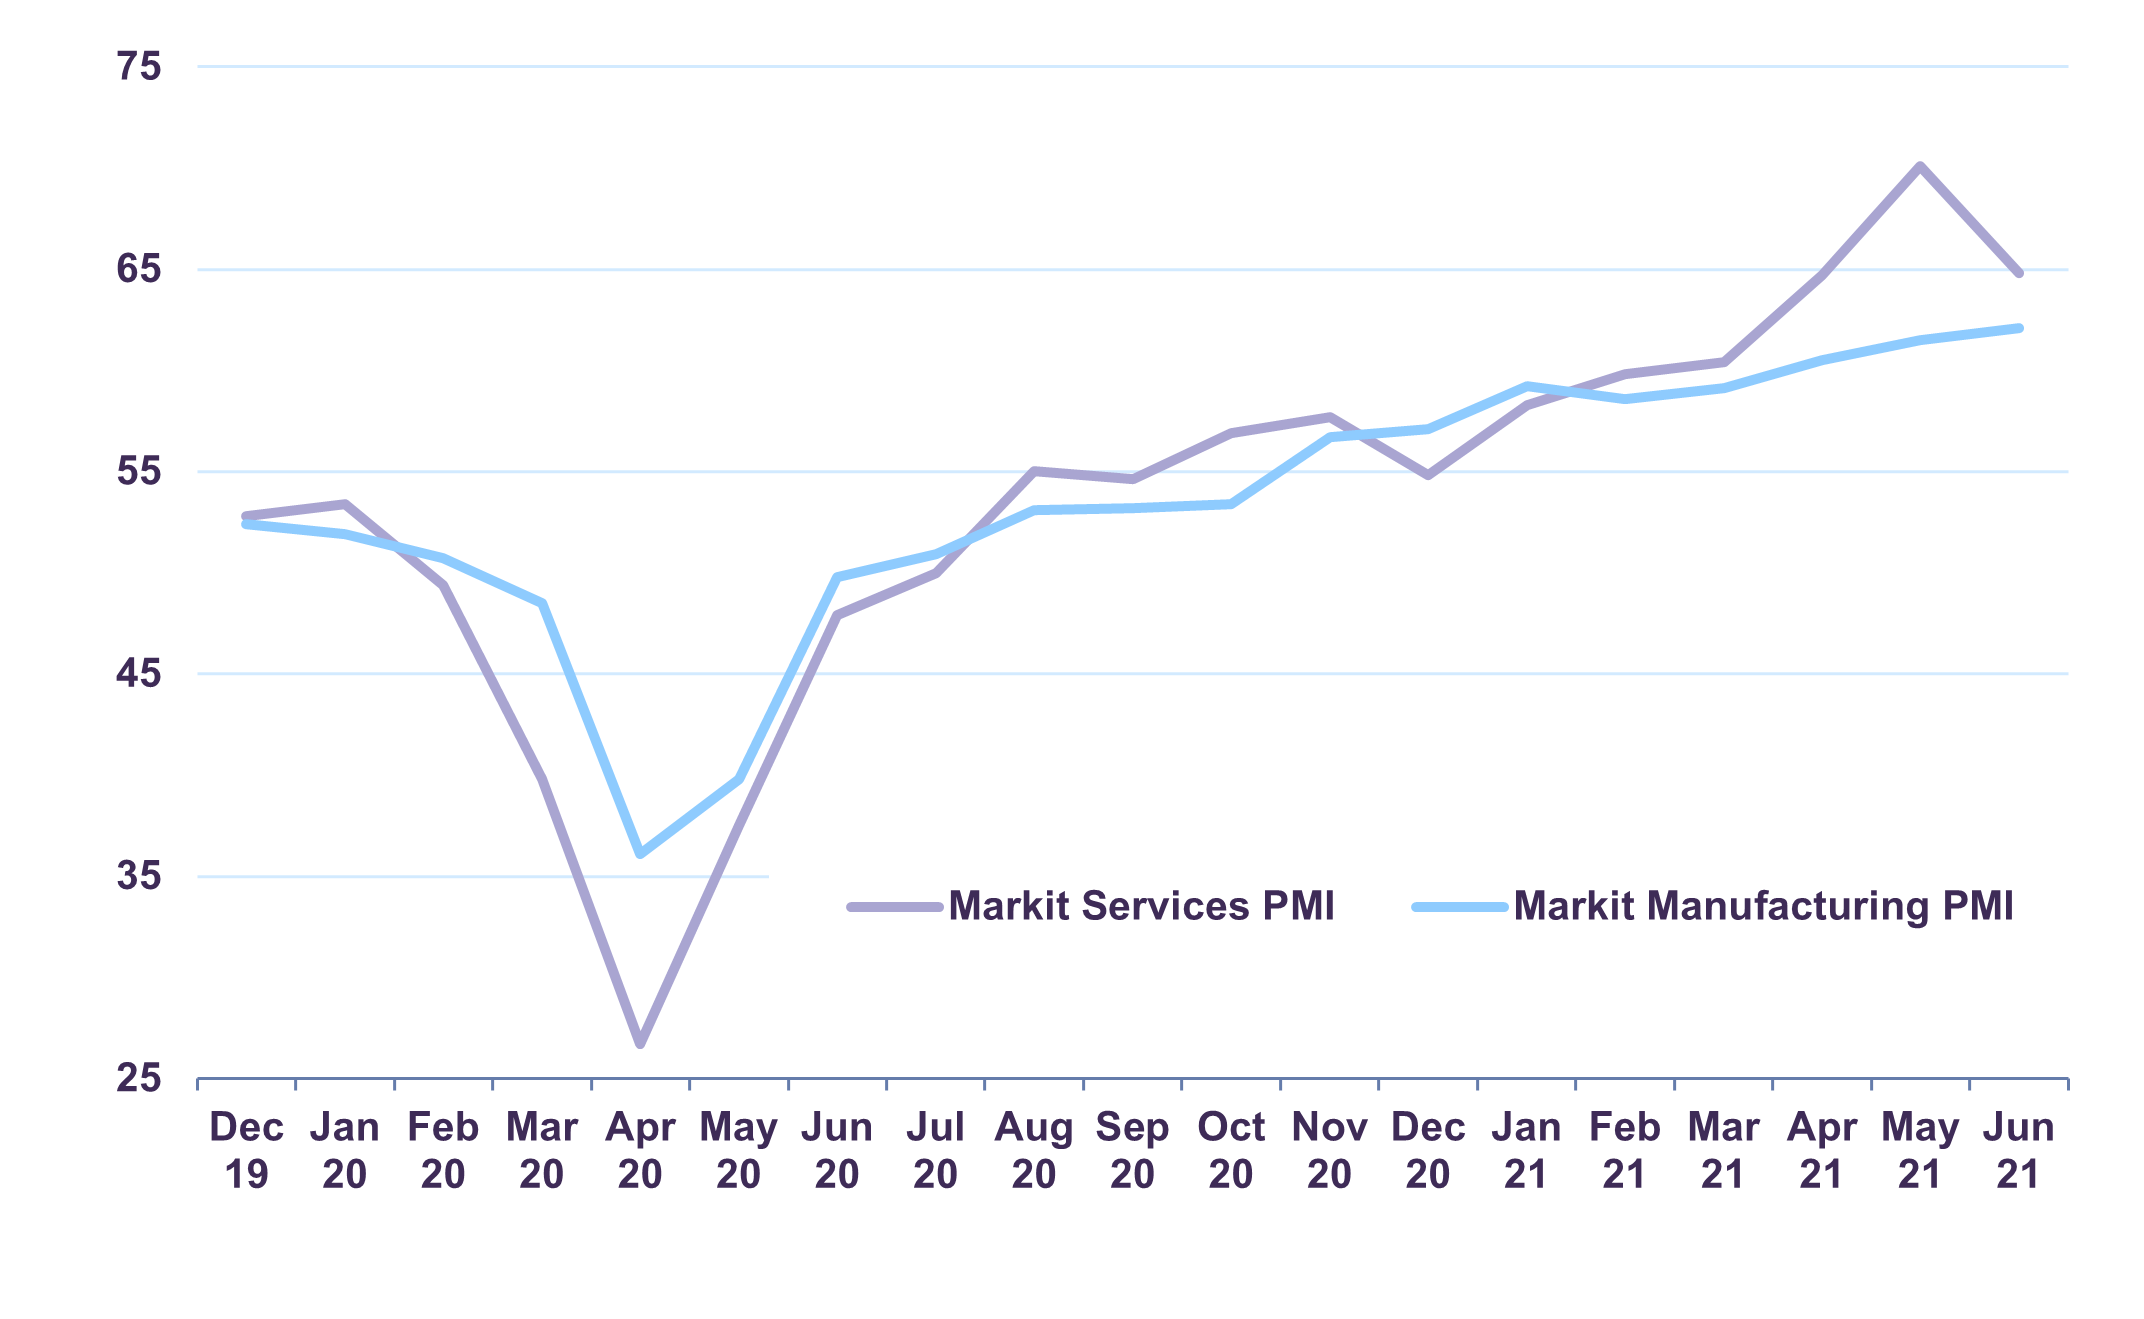
Indeed, forward-looking indicators are robust. In June, the Markit Services Purchasing Managers’ Index (PMI) signalled the second-highest expansion of service sector activity on record, bolstered by the economy’s reopening. The Markit Manufacturing PMI remained at an all-time high in the same period. The reading marked a twelfth consecutive increase in factory activity, driven by strong expansions in output and new orders (Chart 1).
U.S. PMI indexes
Investment spending is reviving as companies adapt to robust demand. Business investment increased 3.3% year-on-year in the three months to March. Capital expenditure on equipment grew 10.9%, while spending on software and R&D rose 6.6%. During the same period, domestic profits increased 19.7%, a positive signal for capital expenditures in the quarters ahead.
U.S. housing market indicators are reflecting pent-up demand and tight supply. New home sales jumped 9.2% versus a year ago in May and existing home sales rose 44.6%. In the same period, the average sales price of new and existing houses were up 16.8% and 17.0% respectively. Average annualized housing starts are running at 1.57 million units, in line with normalized demand of 1.5-1.6 million units. However, we believe that considerable pent-up demand has accumulated following a protracted period of under-building between 2010 and 2018. According to our forecast, pent-up demand for housing may equal three to four million homes, suggesting that U.S. residential investment will contribute to growth going forward.
Government spending surged 2.9% year-on-year in Q1, and the federal deficit reached 21.1% of GDP, nearly triple its long-term average. The prospect of a $1.2 trillion infrastructure plan may add even more stimulus to an already robust economy, further improving the U.S.’s post-pandemic outlook.
With the U.S. economy leading much of the world in vaccination progress and economic normalization, we forecast it will expand 6.4% in 2021, a multi-decade high.
Canadian economy nearing pre-pandemic output
Canada registered the second-best performance among G7 nations through the first three months of the year as real GDP grew 1.4% quarter-on-quarter. Robust real estate activity and surging energy prices more than offset the drag of public health measures in the quarter. Relative to the same period last year, real output increased 0.3%.
Residential investment soared 42.2% year-on-year in Q1, bolstered by low mortgage rates and limited housing supply. In the same period, the average selling price of existing homes increased 18.1% against a year ago. Household net worth reached a new high of C$13.7 trillion in the first quarter, largely due to Canada’s hot housing market. The value of residential real estate increased by a record C$596 billion in Q1, accounting for approximately 80% of total wealth gained in the quarter.
Since then, indicators of housing activity remain strong. Home sales advanced 103.6% against a year ago in May and the regional picture is positive across Canada’s major markets. Home prices in May were up 13.7% in Toronto, 17.6% in Montreal, 11.9% in Vancouver, and 28.4% in Ottawa. Healthy household balance sheets and very low interest rates should alleviate near-term concerns of an overheating housing market.
Canada recorded a trade surplus of C$2.1 billion in Q1, its first surplus since 2008. Total goods exports increased by C$11.8 billion, mainly driven by energy products (C$6.8 billion). The price of Western Canadian Select (WCS) heavy oil narrowed to a minimal $10.25 per barrel discount to West Texas Intermediate (WTI) in March. At $59.52 per barrel as of end-June, WCS is now 60% higher than its pre-pandemic price. Energy sector fundamentals should support Canada’s trade balance and business investment dynamics going forward.
In addition to the positive implications of strong export prices on the Canadian dollar, there is still scope for the currency to appreciate. Despite gaining 4.8% relative to the U.S. dollar since the beginning of the year, the current exchange rate of 0.82 is slightly below its “fair value” of 0.87 (Chart 2). While this suggests further upside for the Canadian dollar, the bulk of the adjustment appears to have already occurred.
Canadian dollar vs. fair value
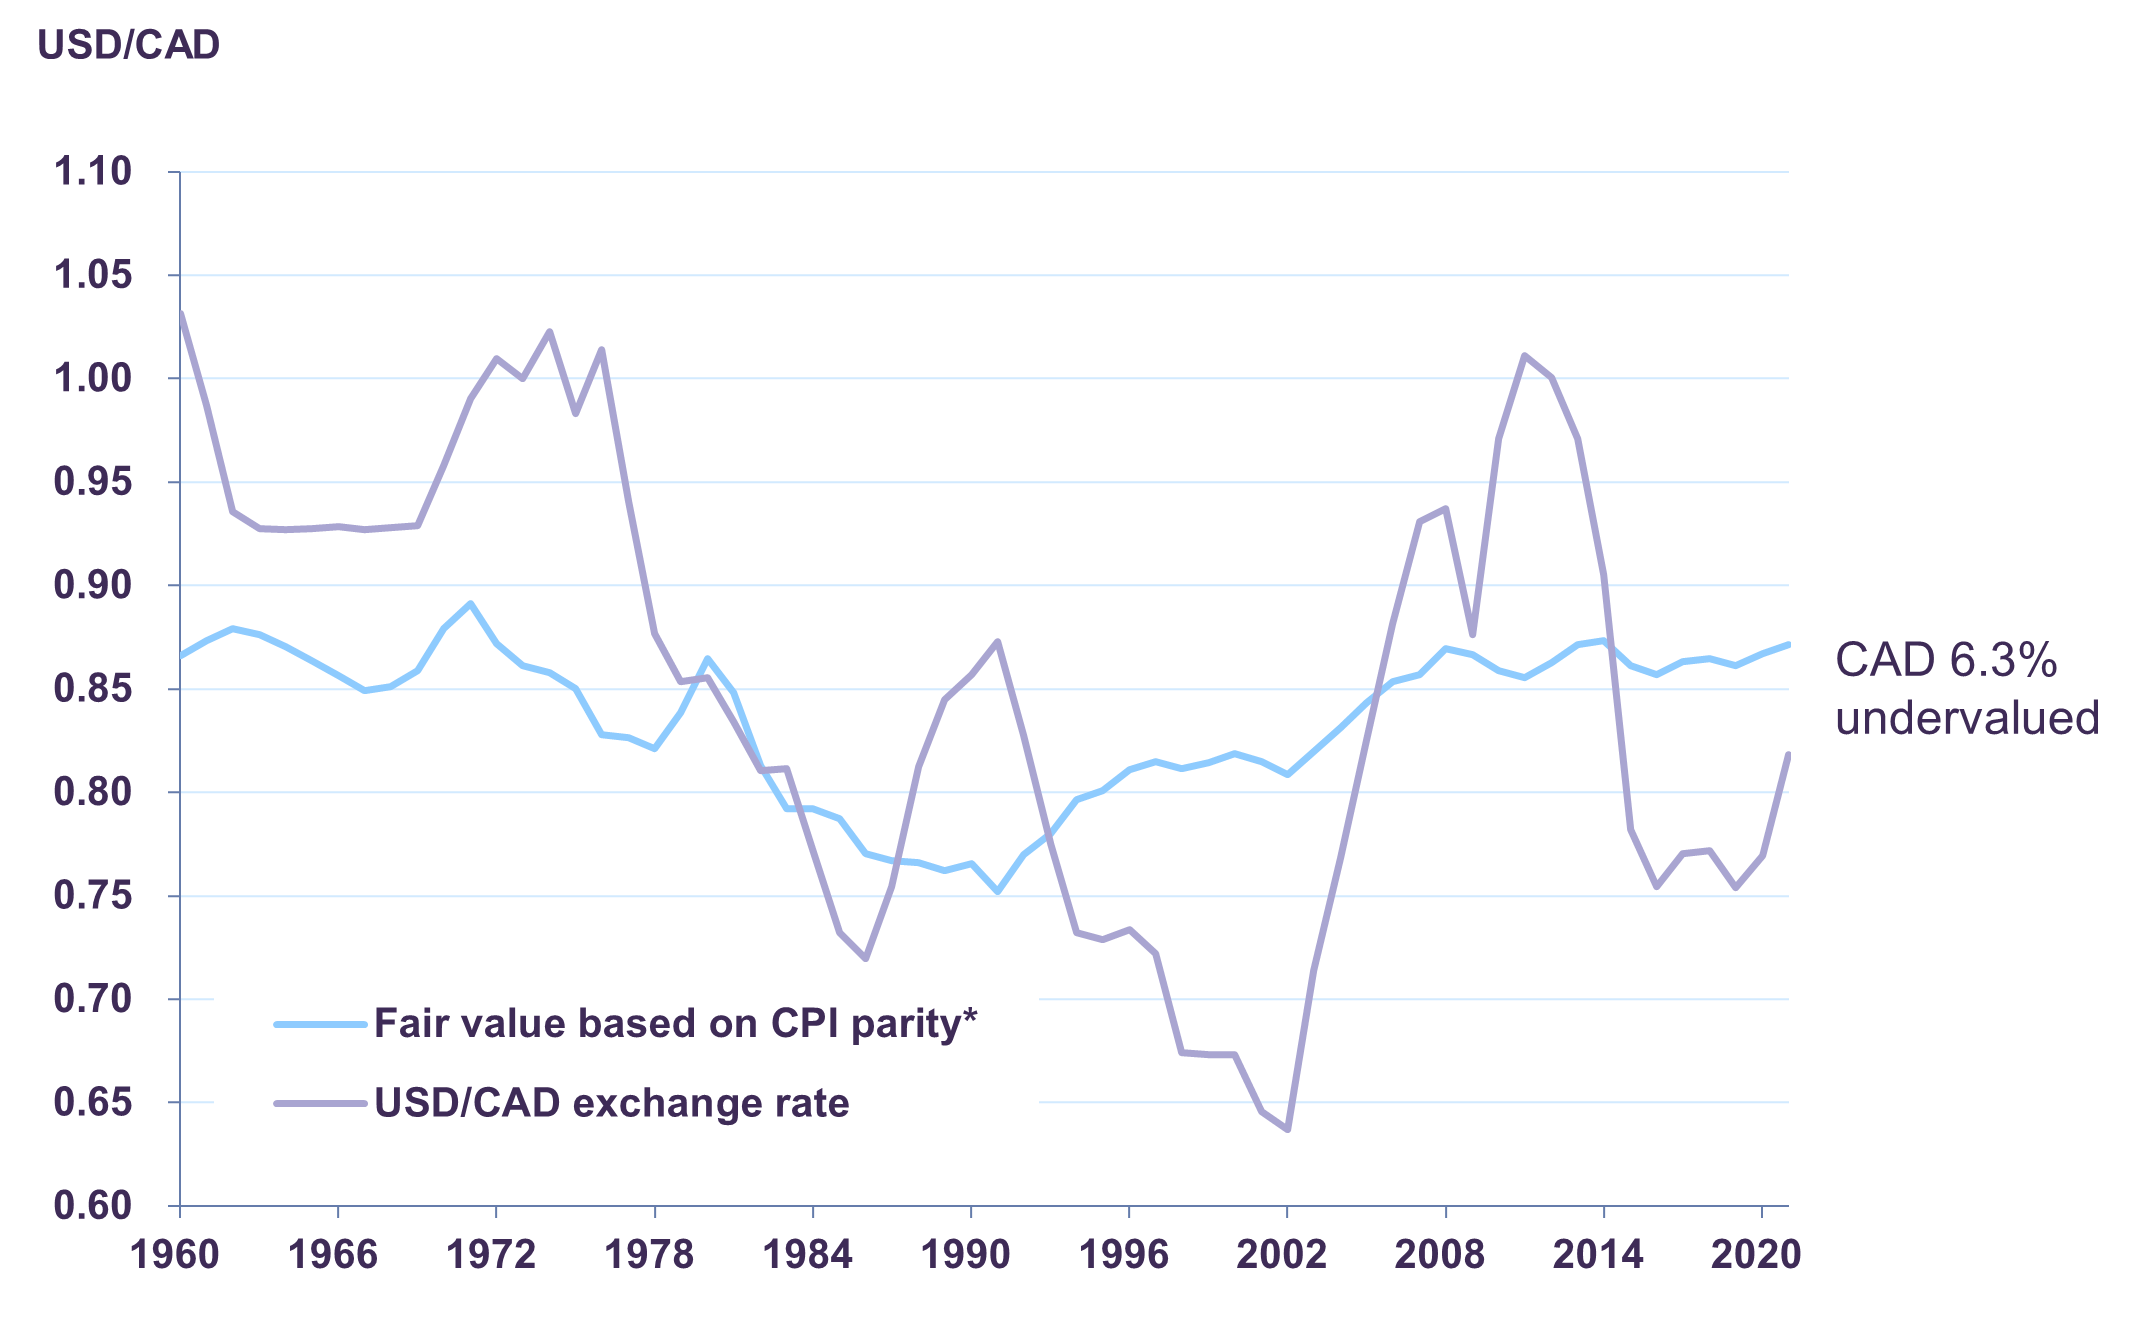
Source: Bank of Canada, Letko Brosseau
Activity restrictions caused consumer spending to contract by 0.8% year-on-year in Q1 but the outlook for household consumption remains constructive. Disposable income rose 9.1% in the first quarter, and the savings rate registered its fourth consecutive reading in double-digit territory at 13.1%. At 8.2% in May, the unemployment rate is much improved from its mid-pandemic peak of 13.7%. Going forward, households will continue to benefit from federal wage and rent subsidies well into the second half of 2021.
In real GDP terms, Canada has regained nearly all of the output lost during the pandemic and the recovery is accelerating thanks to rapid reopening. We expect the Canadian economy to grow 5.0% in 2021, a 20-year high.
European outlook improving
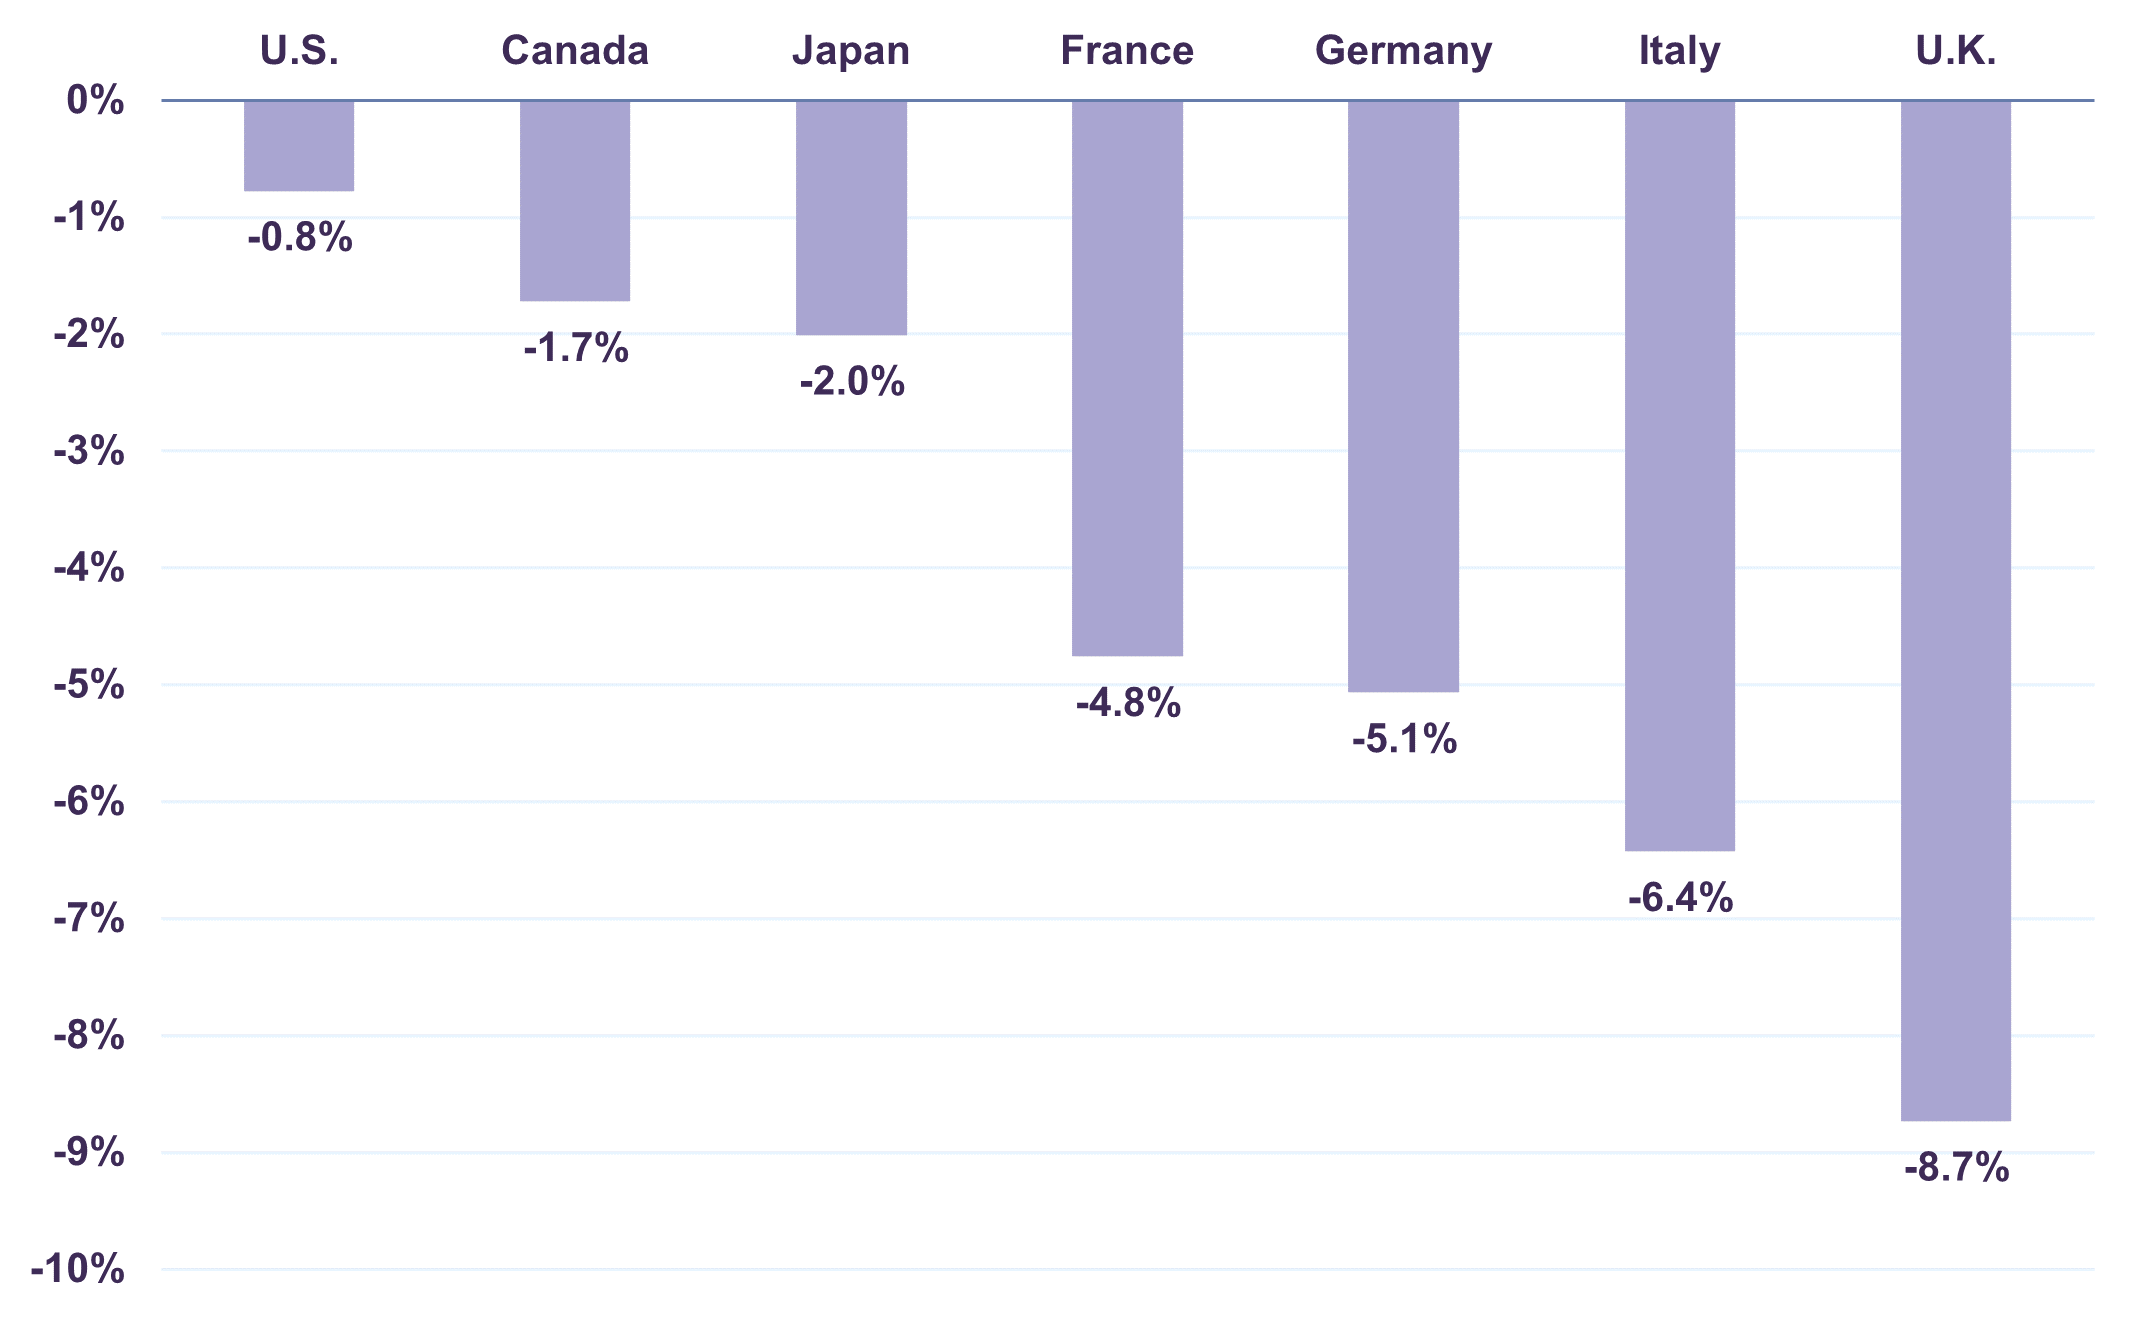
Real GDP in the eurozone decreased 0.3% quarter-on-quarter in Q1, which corresponded with a 1.3% contraction against the same period last year. Most major economies in the region experienced a quarterly decline in activity amid tightened COVID-19 countermeasures. Consequently, recovery in the eurozone is trailing that of other G7 economies (Chart 3).
Real GDP % gap vs. Q4 2019
After a partial recovery in the second half of 2020, German real GDP declined 1.8% quarter-on-quarter in the three months to March. This translated to a 3.1% decline against a year ago. Solid increases in government spending (6.4%), net exports (24.7%) and business investment (0.9%) were insufficient to offset the large 7.1% contraction of household expenditure in Q1 brought on by renewed lockdowns.
Consumer services suffered a decline of 4.9% in Q1. Conversely, German manufacturing remained resilient, expanding 0.4% over the same period. The industrial sector should continue to support growth in the second half of 2021. In April, industrial production increased 26.4% year-on-year and in June, the Markit Manufacturing PMI signalled a twelfth-consecutive expansion in factory activity.
Consumption is likely to re-emerge as a driving force of economic activity in the coming quarters as Germany proceeds with reopening. Private savings are nearly double 2019 levels. Retail sales, an important signpost for consumer activity, grew 4.2% quarter-on-quarter in May, and were up by 7.5% against pre-pandemic levels despite the continued shutdown of the non-food retail sector.
The IMF forecasts Europe’s largest economy will expand by 3.6% in 2021, underpinned by the prospect of economic normalization in the second half of the year.
France, for its part, entered a more advanced stage of recovery as real GDP grew 1.2% year-on-year in Q1. Residential investment jumped 10.3% in nominal terms, business investment rose 8.2%, and government spending increased 6.0%. Private spending declined by 0.2% in the first quarter but is likely to rebound going forward. Disposable personal incomes grew 3.3% against a year ago, the jobless rate returned to pre-pandemic levels in Q1 and the household savings rate is still elevated. France’s economy is expected to expand by 5.8% in 2021, one of the fastest rates of growth among major European economies.
Recoveries are uneven across the eurozone due to differences in the evolution of each country’s battle with COVID-19. On balance, however, the regional outlook is improving, supported by an acceleration in vaccine rollout and reopening. We anticipate the eurozone will expand by 4.4% in 2021.
Uneven emerging market recoveries
In Q1, real GDP in China surged 18.3% year-on-year, bolstered by continued strength in the industrial sector. Manufacturing output jumped 24.4% through the first three months of the year. Industrial production grew 8.8% against a year ago in May, adding to an impressive expansion that started in April 2020. To date, industrial output is 13.6% above pre-pandemic levels. China’s Manufacturing PMI reached 51.3 in June, pointing to continued momentum in factory activity going forward.
Overseas demand remains a key driver of China’s economic expansion. Exports advanced for an eleventh straight month in May, increasing 27.8% year-on-year. Outbound shipments to the U.S., the EU and ASEAN all posted sizable gains of 20.6%, 12.6% and 40.6% respectively. Imports increased by 51.1% over the same period, reflecting firming domestic demand and strong commodity prices. At $45.5 billion, China’s trade surplus remains robust.
Outside of manufacturing and trade, momentum continues to build across a variety of indicators. Retail sales increased 12.4% against a year ago in May while home sales advanced 56.5%, supported by strong domestic demand. As of end-May, domestic airline passenger traffic was just 6.4% below pre-pandemic levels, an encouraging sign of the breadth of China’s recovery.
Underpinned by robust economic fundamentals and rapid vaccination progress, China’s economy is on track to register its fastest expansion in 10 years. Real GDP is expected to increase by 8.4% in 2021.
Real GDP in India expanded 1.6% year-on-year in Q1. A resurgence of COVID-19 weighed on the nascent recovery in the second quarter, albeit less than the first wave. Shorter and better-targeted lockdown measures are expected to help Asia’s third-largest economy record the world’s fastest expansion in 2021. The IMF forecasts India’s real GDP to grow 12.5% this year.
In other emerging economies, recoveries are less advanced. Countries such as Brazil and South Africa are still dealing with elevated caseloads, and vaccine access is a regional challenge. Prospects for wider rollouts in the developing world are improving, however, thanks to international vaccine sharing initiatives such as COVID-19 Vaccines Global Access (COVAX). With the region expected to make significant inoculation progress in the second half of the year, the IMF anticipates emerging market real GDP will expand 6.7% in 2021.
Inflation a byproduct of stimulus-led recovery
Prices are rising in many advanced economies, raising fears of inflation and policy tightening. In the U.S., headline CPI climbed 5.0% year-on-year in May, the highest price level increase since 2008, and core inflation surged to a 29-year high in the same period. Prices in Canada increased at the fastest pace in nearly a decade and inflation in the eurozone reached a multi-year peak.
To date, most inflationary pressures are concentrated in goods rather than services. Supply constraints in the semiconductor industry continue to pressure prices in products as diverse as automobiles and washing machines. Used car and truck prices in the U.S. jumped 29.7% year-on-year in May, the result of robust consumer demand and limited supply. Gasoline prices in Canada soared 62.5% in April compared to a year ago when prices hit an eleven-year low. Services inflation could pick up as this still-lagging area of the economy reopens in the coming months.
On balance, we view a revival of inflation as confirmation of a strong stimulus-led recovery. The U.S. Federal Reserve took note at its June policy meeting and consequently moved forward the timeline for interest rate hikes by a year. Policy rate rises are now scheduled for 2023, signalling that a reversal of monetary stimulus is still some time away. On the fiscal policy front, the current administration does not see inflation as a reason to pause its $1.2 trillion infrastructure plan. Policy in Canada is equally accommodative. The Bank of Canada vowed to maintain its target rate at 0.25% until excess capacity is absorbed, and the federal government recently introduced a three-year C$101.4 billion stimulus plan. Elsewhere, the European Central Bank’s €1.85 trillion Pandemic Emergency Purchase Plan (PEPP) will run to at least March 2022 with reinvestment of maturing securities through 2023, and the EU’s €750 billion recovery fund will support growth well into the recovery. Moreover, the G7’s recently announced multi-billion-dollar global infrastructure plan signals an international commitment to expansionary fiscal policy for years to come.
Are markets overly optimistic?
Global equity markets rose to new record highs in Q2 on upward revisions to company earnings and improving economic momentum. The total return of the S&P 500 was 12.0% year-to-date (in Canadian dollar terms), while the S&P/TSX (17.3%), FTSE 100 (9.2%), DAX (6.9%), MSCI World (9.9%) and MSCI EM (4.4%) all climbed higher during the year.
Broad market highs against a backdrop of rising inflationary pressures and an uneven global economic recovery have led to concerns over whether equities are overvalued. The S&P 500 Index currently trades at 20.3 times 2022 estimated earnings, 35% above its long-term average of 15x, lending support to the view that valuations have been pushed into rich territory. As explained in our June Portfolio Update, however, our analysis shows that a subset of companies are biasing metrics upward. The top 20% highest valuation stocks of the S&P 500 currently trade at an average 70.8 times estimated 2022 earnings while the bottom 20% trade at a modest 10.5 times P/E.
In addition, when considering a broader universe of companies, equities appear to be far from uniformly expensive. The 2022 P/E multiple for the Russell 3000 Index is 21.3, but the Russell 3000 Value Index trades at 16.7 times 2022 earnings while the P/E multiple for the Russell 3000 Growth Index is an elevated 28.9. The presence of large discrepancies in relative valuations across different segments of the market signals both caution and opportunity.
We believe economic fundamentals support an outlook for strong earnings growth. Through the first five months of the year, earnings estimates for 2021-22 were revised higher for nearly 70% of companies in the S&P 500 Index. As reopening continues, many service-oriented businesses that were disproportionately impacted by the pandemic should realize strong upside potential. Industries such as airlines, airports and malls should benefit from a return to normal.
In our view, our portfolios are particularly well suited for the current environment and offer considerable potential for value creation over the medium-term. Our global equity portfolio is valued at a reasonable 11.9 times 2022 earnings (Chart 4) and offers an attractive dividend yield of 2.7%.
Equity valuation comparison
Forward P/E ratio (2022 earnings estimates)
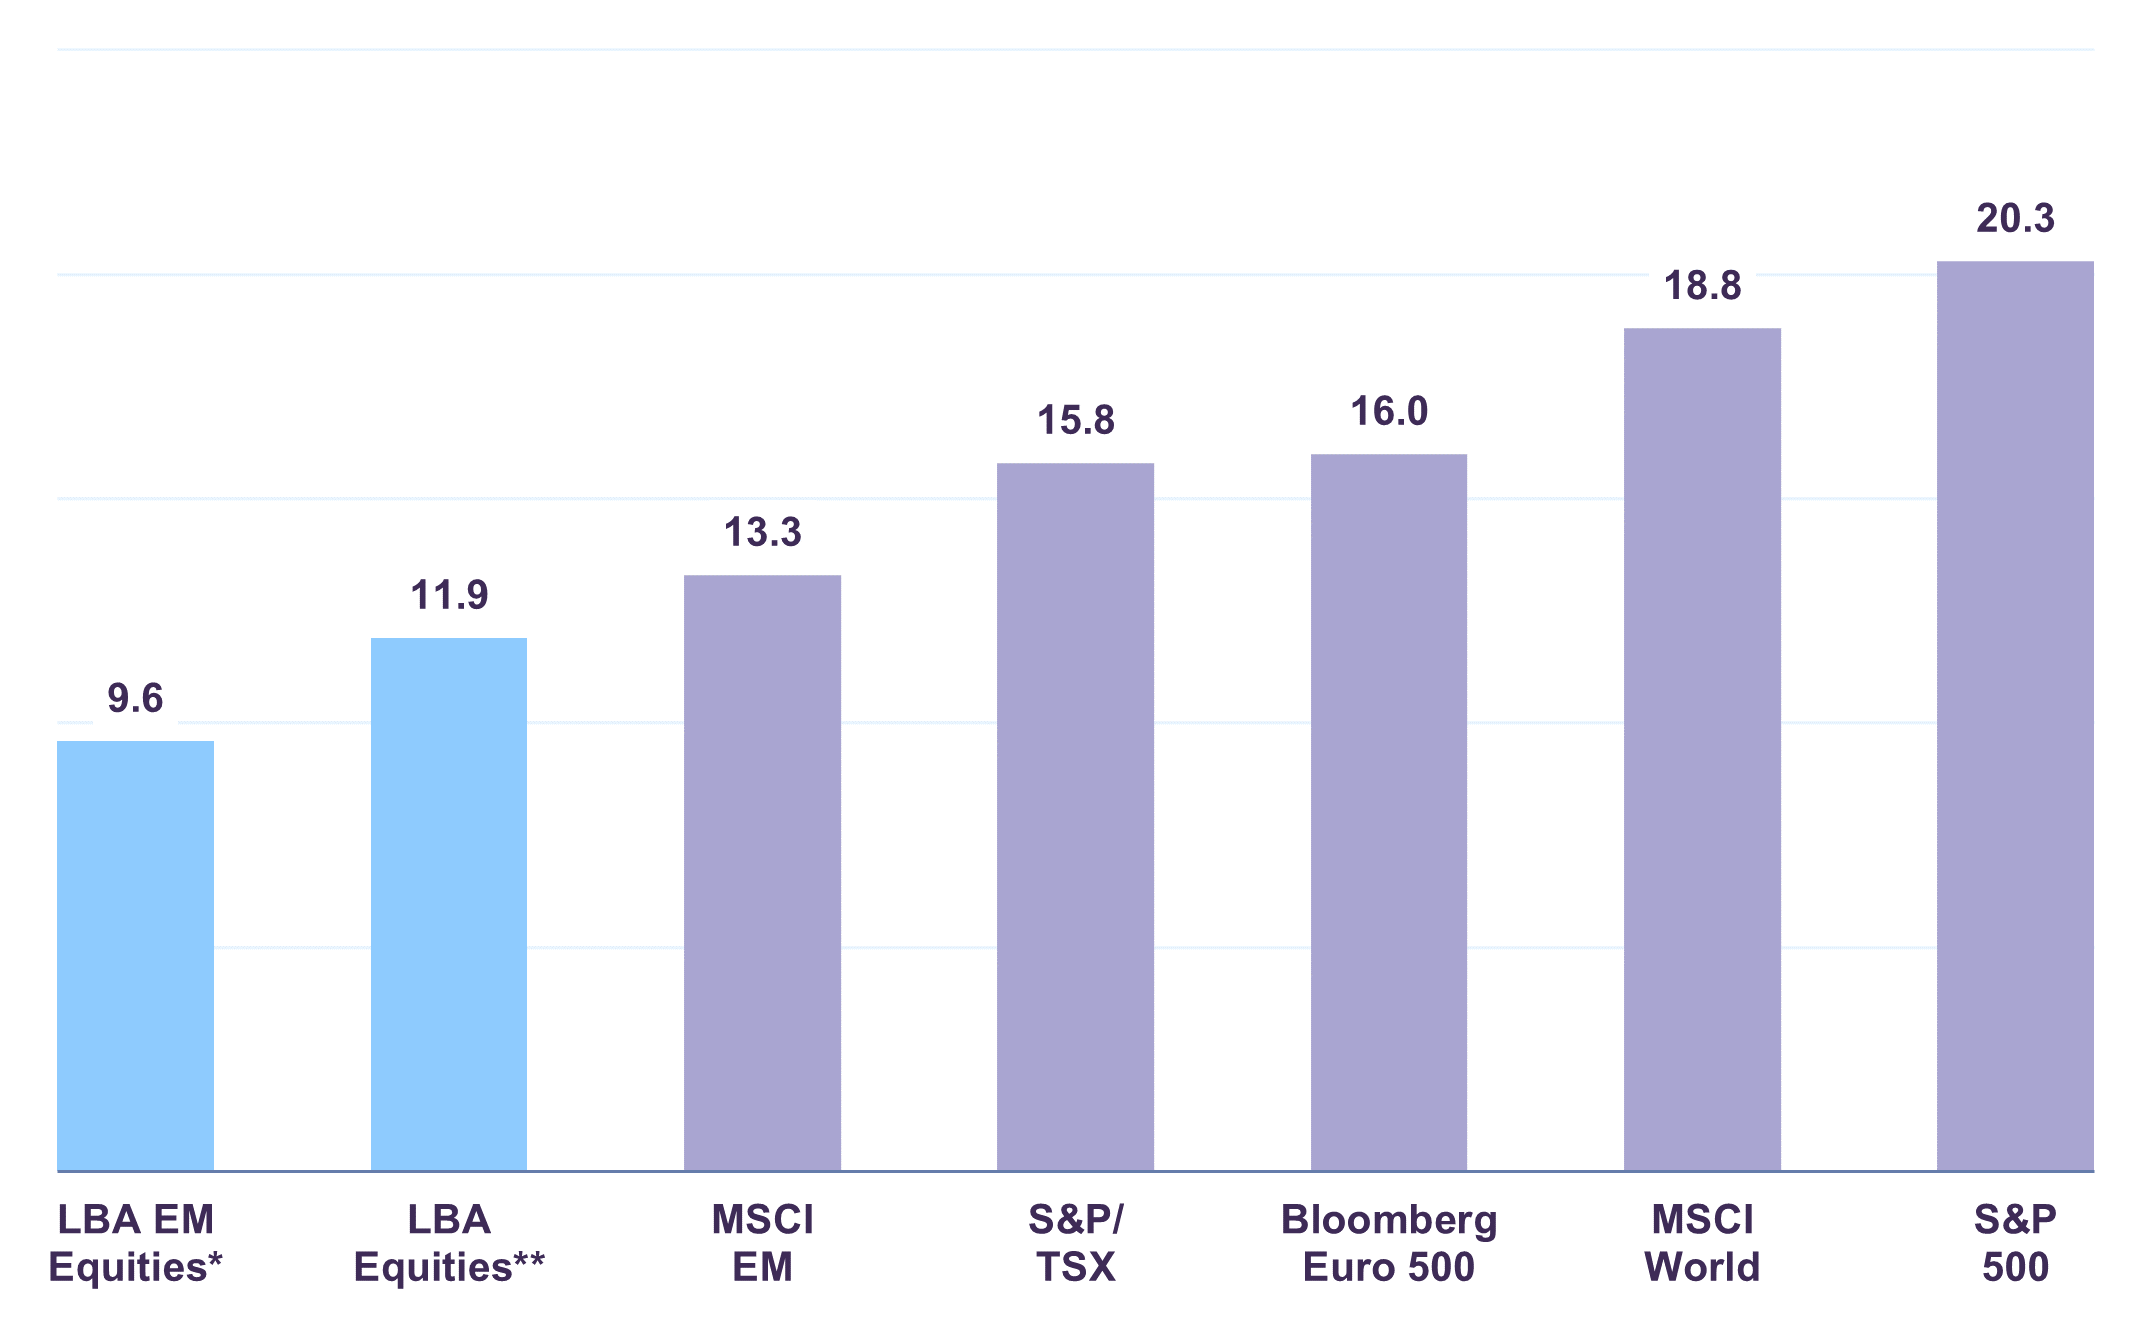
** Letko Brosseau Equity Fund
Source: Bloomberg as at July 6, 2021
While equities continue to adjust to strengthening global activity, bond markets do not fully reflect the current reality of higher growth and inflation. At 1.44%, the yield on the 10‑year U.S. government bond is well below the 4% level that is consistent with modest estimates of 2% real GDP growth and 2% inflation. In Canada, despite a 290-basis-point increase in the inflation rate since the beginning of the year, the 10-year federal government bond yield only increased by 72 basis points. Interest rates could remain low for some time given the accommodative stances of central banks. However, monetary authorities’ willingness to tolerate higher inflation and governments’ multi-year expansionary policies weigh heavily on the risk/return relationship offered by bonds.
We continue to favour a diversified portfolio of well-valued equities over bonds. Capital preservation and low duration remain the focus of our fixed income strategy.
Legal notes
All dollar references in the text are U.S. dollars unless otherwise indicated.
The information and opinions expressed herein are provided for informational purposes only, are subject to change and are not intended to provide, and should not be relied upon for, accounting, legal or tax advice or investment recommendations. Any companies mentioned herein are for illustrative purposes only and are not considered to be a recommendation to buy or sell. It should not be assumed that an investment in these companies was or would be profitable. Unless otherwise indicated, information included herein is presented as of the dates indicated. While the information presented herein is believed to be accurate at the time it is prepared, Letko, Brosseau & Associates Inc. cannot give any assurance that it is accurate, complete and current at all times.
Where the information contained in this presentation has been obtained or derived from third-party sources, the information is from sources believed to be reliable, but the firm has not independently verified such information. No representation or warranty is provided in relation to the accuracy, correctness, completeness or reliability of such information. Any opinions or estimates contained herein constitute our judgment as of this date and are subject to change without notice.
Past performance is not a guarantee of future returns. All investments pose the risk of loss and there is no guarantee that any of the benefits expressed herein will be achieved or realized.
The information provided herein does not constitute investment advice and it should not be relied on as such. It should not be considered a solicitation to buy or an offer to sell a security. It does not take into account any investor’s particular investment objectives, strategies, tax status or investment horizon. There is no representation or warranty as to the current accuracy of, nor liability for, decisions based on such information.
This presentation may contain certain forward-looking statements which reflect our current expectations or forecasts of future events concerning the economy, market changes and trends. Forward-looking statements are inherently subject to, among other things, risks, uncertainties and assumptions regarding currencies, economic growth, current and expected conditions, and other factors that are believed to be appropriate in the circumstances which could cause actual events, results, performance or prospects to differ materially from those expressed in, or implied by, these forward-looking statements. Readers are cautioned not to place undue reliance on these forward-looking statements.
The MSCI information may only be used for your internal use, may not be reproduced or redisseminated in any form and may not be used as a basis for or a component of any financial instruments or products or indices. None of the MSCI information is intended to constitute investment advice or a recommendation to make (or refrain from making) any kind of investment decision and may not be relied on as such. Historical data and analysis should not be taken as an indication or guarantee of any future performance analysis, forecast or prediction. The MSCI information is provided on an “as is” basis and the user of this information assumes the entire risk of any use made of this information. MSCI, each of its affiliates and each other person involved in or related to compiling, computing or creating any MSCI information (collectively, the “MSCI parties”) expressly disclaims all warranties (including, without limitation, any warranties of originality, accuracy, completeness, timeliness, non-infringement, merchantability and fitness for a particular purpose) with respect to this information. Without limiting any of the foregoing, in no event shall any MSCI Party have any liability for any direct, indirect, special, incidental, punitive, consequential (including, without limitation, lost profits) or any other damages. (www.msci.com).
Concerned about your portfolio?
Subscribe to Letko Brosseau’s newsletter and other publications: