 Canada - FR
 U.S. - EN
A strategy that pays off:
maximizing returns through a risk/reward approach
March 10, 2023
The vast majority of investment managers do not outperform the indices over the long-term. In Canada and the U.S., approximately 80% of domestic managers lagged their benchmark gross of fees over the past 10 years1. Letko Brosseau has managed the impressive feat of outperforming its benchmark in Canadian equity, balanced and bond portfolios, not just over the last decade, but also over the past 35 years.
Our approach is to evaluate the individual merits of each investment while simultaneously judging its risk/reward impact on the portfolio. This fundamental investing philosophy, combined with price sensitivity, is what we believe allowed us to add significant value over time.
Using this approach, we achieved strong outperformance in the fixed income market. Over the last four years, the measurement period generally used by institutional investors, the annual total return of the fixed income segment of the Letko Brosseau Global Balanced (Canadian Bias) Composite was 0.8% compared with 0.0% for the benchmark.
Over the last year, a turbulent period for bonds, our return was ‑3.3% against -11.7% for the benchmark, ranking us amongst the best fixed income managers in the country. Indeed, the firm ranked #1 in eVestment for Canadian fixed income strategies (core) for one year and 8th for four years, amongst a group of 67 similar strategies2.
Letko Brosseau Global Balanced (Canadian Bias) Composite
Compounded Annualized Returns as of December 31, 2022(1)(2)
| 1 yr. | 2 yrs. | 3 yrs. | 4 yrs. | 5 yrs. | 10 yrs. | 15 yrs. | Since Inception* |
|
| LBA Global Balanced (Canadian Bias) Composite | -1.0% | 7.8% | 5.3% | 6.8% | 4.3% | 7.7% | 6.2% | 10.8% |
| Benchmark(2) | -10.0% | -0.6% | 2.8% | 5.6% | 4.1% | 6.5% | 5.2% | 7.3% |
| Bond segment | -3.3% | -1.9% | 0.0% | 0.8% | 1.0% | 1.6% | 3.1% | 7.7% |
| Benchmark(2) | -11.7% | -7.2% | -2.2% | 0.0% | 0.3% | 1.6% | 3.2% | 6.4% |
| Equity segment | -0.8% | 12.2% | 7.1% | 9.4% | 5.3% | 10.8% | 7.3% | 12.9% |
| Benchmark(2) | -10.0% | 4.0% | 6.4% | 9.9% | 6.9% | 10.4% | 6.7% | 8.0% |
Based on equity and fixed income prices as of December 31st, 2022, in Canadian dollars. *The Composite inception date is January 1, 1988. (1) Data is preliminary. (2) Please refer to the notes at the end of this document for information on the composite and benchmarks.
Our balanced mandates have also added significant value over the long-term. By analysing asset classes in the same way that we evaluate individual securities, we were able to maximize the total value of our balanced portfolios without jeopardizing their risk profile. Over the last four years, the annual total return of the Letko Brosseau Global Balanced (Canadian Bias) Composite was 6.8% compared with 5.6% for the benchmark and, over the last year, our return was -1.0% against -10.0% for the benchmark. These returns allowed us to rank in the top fifth of all balanced managers for both periods according to eVestment.3
Events and market circumstances can have a detrimental effect on any manager’s relative performance in the short run. However, we believe our fundamental approach is the most reliable way to maximize the return of our clients’ portfolios while providing downside protection across different market cycles, including turbulent periods. Our long-term track record in managing equities, bonds and balanced mandates indicates that we have successfully met this objective.
Avoiding the fall: how we preserved capital in the fixed income space
During the period following the 2008-09 financial crisis and, more recently, the pandemic recession, massive central bank interventions pushed interest rates to historic lows. At its trough, the Government of Canada 30-year bond yielded only 0.7%, its lowest yield ever. Elsewhere in the world, interest rates even turned negative, promising their investors the prospect of value destruction. To quote Warren Buffett, bonds appeared to offer “return-free risk” during much of the past decade.
Defining risk in a portfolio context means different things to different investors. A common approach is to use quantitative measures such as standard deviation or portfolio beta. Equating risk with volatility and asset price fluctuations, these measures ignore the danger of investing in overvalued and/or troubled securities. To incorporate these critical factors, we view risk as the potential to suffer a permanent loss of capital. Making sound decisions based on a fundamental approach which emphasizes buying quality investments and paying a fair price is, in our opinion, the best way to control for risk.
With this risk/reward approach in mind, we concluded that the prospects offered by fixed income instruments were extremely unattractive. In our assessment, the small incremental yield offered by long-term bonds presented excessive risk for little value, given their low yield and high sensitivity to interest rate increases. Our strategy, instead, emphasized capital preservation. To that end, and to limit the exposure to rising interest rates, we chose to maintain zero exposure to bonds with maturities above 10 years and, instead, elected to invest all our fixed income assets in high quality short- and medium-term bonds. As interest rates generally remained low over the last decade and a half, this strategy at times appeared to have been a mistake. Indeed, relative performance in our bond portfolio lagged benchmark returns in some years.
Canadian Long-Term Bond
Yield to Maturity
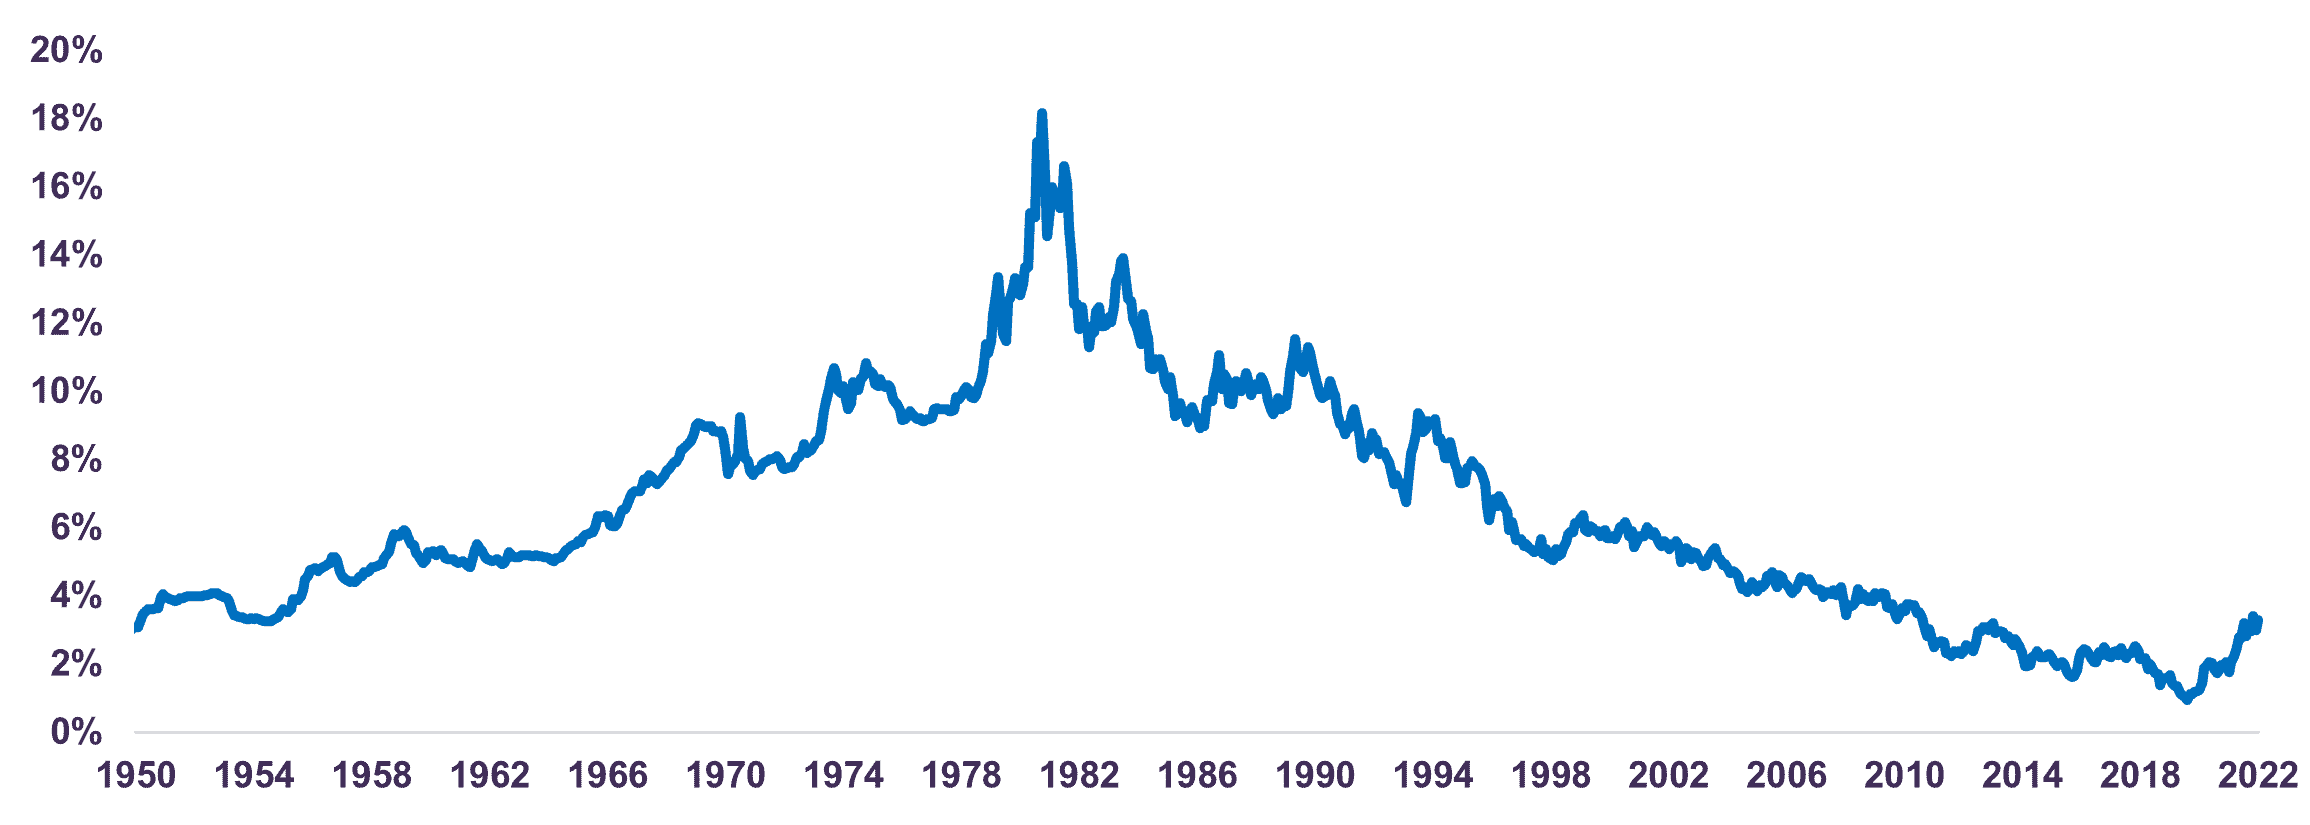
Source: “A History of Interest Rates” by Sidney Homer and Richard Sylla and Bloomberg data, as of December 31, 2022.
Pinpointing exactly when bonds will trade at a fair value is difficult, and it was never our goal. Rather, history shows that overvalued asset prices eventually correct to reflect their fair value and, in the meantime, we did not believe investors were sufficiently compensated for the excess risk they were taking. In 2022, nearly all this accumulated relative underperformance was erased when interest rates quickly jumped towards what we and most central bankers estimate to be levels consistent with long-term economic activity and inflation, a gauge of fair value for bonds.
30YR Canadian Government Bond Price
(Bond maturing in 2041)
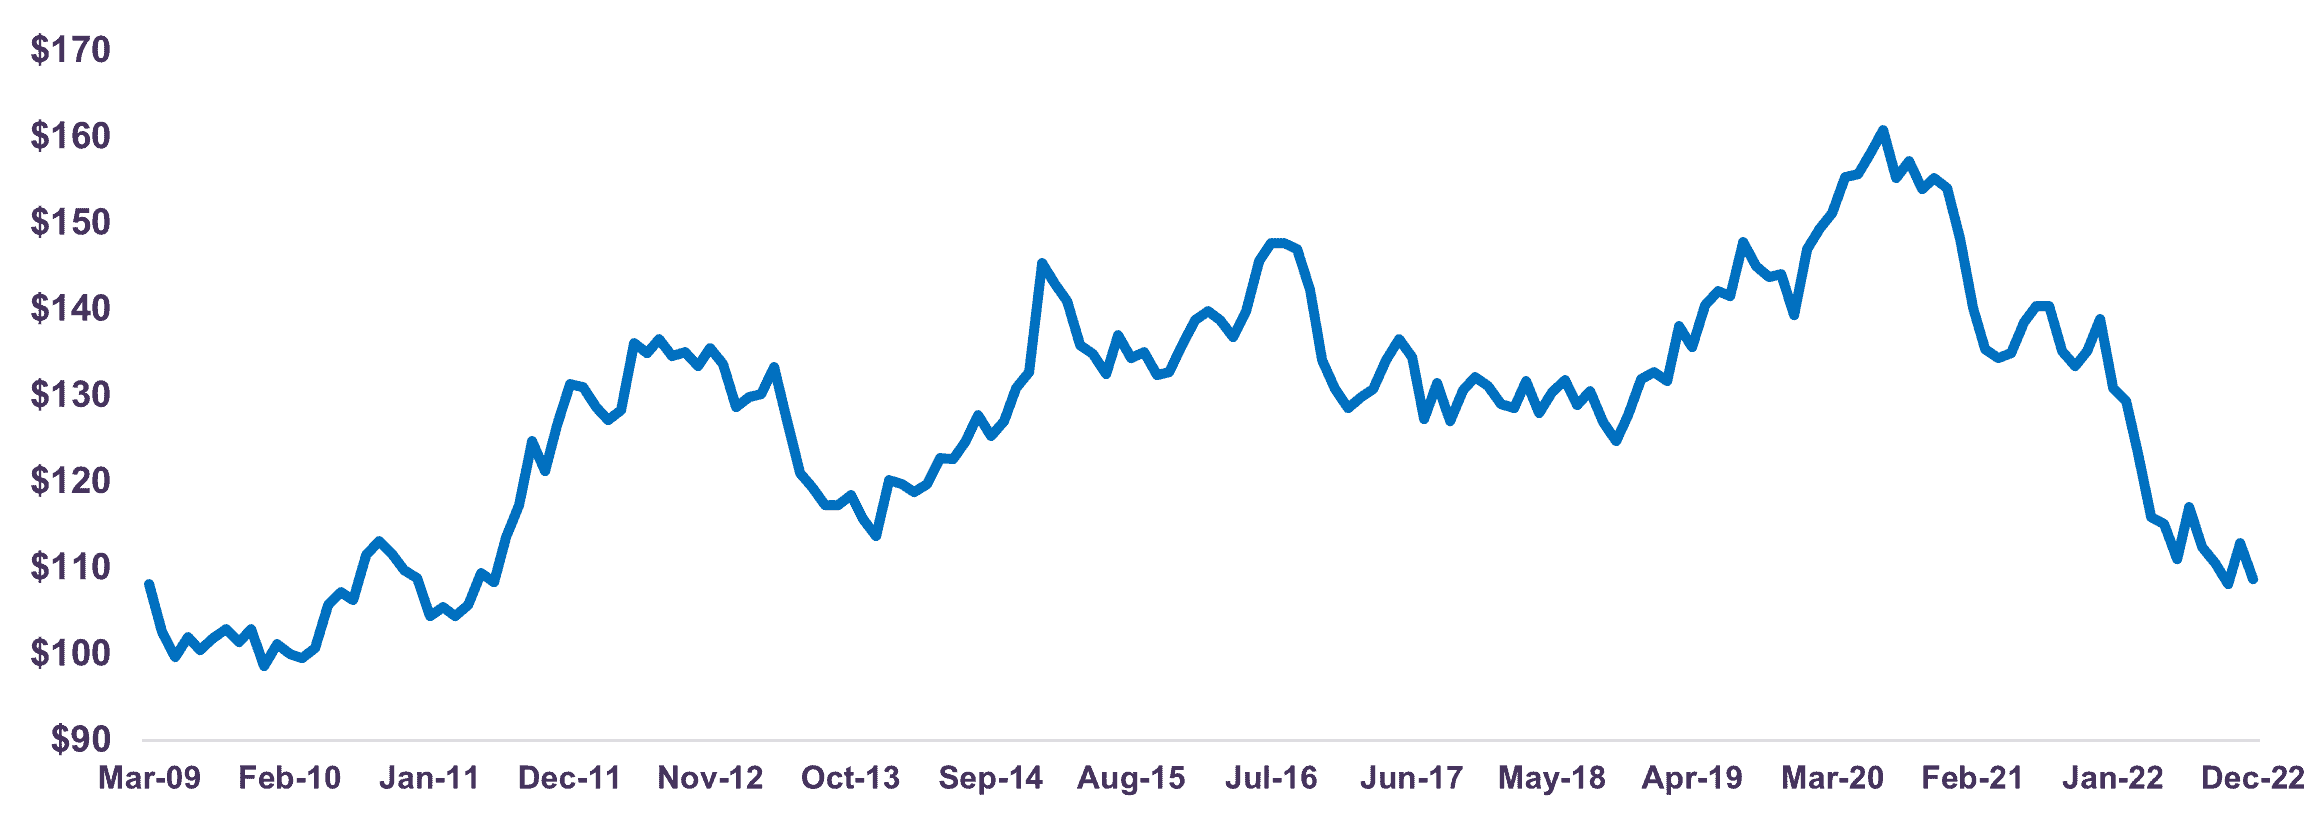
Source: Bloomberg data, as of December 31, 2022.
For investors in long-term fixed income instruments, the focus on capturing small incremental yield seemingly worked well for a time, but it ultimately resulted in significant losses. Meanwhile, having removed this risk from our portfolio, we were able to ensure that capital was preserved. This perfectly illustrates the importance of focusing on a sound risk/reward strategy while avoiding overvalued securities, even when the overvaluation persists for many years.
A holistic approach to investing: maximizing value in a balanced strategy
Reducing interest rate risk was only part of the overall strategy that we implemented over the last decade. Within the context of balanced mandates and given our view that long-term bonds were an unattractive investment, we preferred to invest in equities where the risk/reward relationship was the greatest.
Over the last decade, a 10-year bond issued at a 2.0% coupon traded at the equivalent of 50 times earnings, with no prospect of growth in earnings and no ultimate chance of a higher return. An equity portfolio trading at 13 times growing earnings and offering a 3.0% dividend yield seemed a much more attractive investment alternative. In fact, the spread between expected equity returns and bonds returns hit record highs as interest rates hit bottom.
We therefore elected to take a holistic approach to maximize the total return of the balanced portfolio. The decision to reduce risk in the bond portfolio – and potentially give up returns in the short-term if long bond yields fell – was taken in conjunction with the decision to add equity exposure, where return expectations far exceeded those of bonds. This decision was instrumental in generating above market returns: over the last four years, the total return of the Letko Brosseau Global Balanced (Canadian Bias) Composite was 6.8% per year, or 1.2% annually above the benchmark.
At first glance, it is not always readily apparent just how much value is created (or destroyed) by such decisions. Analysing asset class performance on an individual and separate basis fails to properly measure the impact of asset allocation strategies. In other words, it does not consider the benefits of a holistic approach to portfolio management, such as we implemented in recent years.
Isolating the value generated by this strategic decision, we calculate that 68%4 of the outperformance over the last four years came from our asset allocation strategy. Importantly, this desirable outcome was achieved without taking undue risks. By focusing on avoiding overvalued securities and constantly seeking undervalued opportunities, we were able to build a portfolio that maximizes return and minimizes risk, a strategy that paid off handsomely.
Looking ahead: staying vigilant for opportunities
Investment success depends on being able to continuously identify and assess new risks and opportunities that could impact our risk/reward strategy. At the end of December 2022, the Government of Canada 30-year federal bond yielded 3.3%. Federal bonds with a shorter maturity of five years yielded 3.4%. Moreover, banks are now offering non-cashable Guaranteed Investment Certificates (GICs) at around 5.0% for two years, a return that may seem attractive.
A forecast of the expected returns that each asset class will generate over the next 3-5 years is necessary to determine the best risk/reward strategy going forward. To that end, our economic outlook is critical in constructing our growth projections.
At present, the global economy is decelerating as monetary authorities are tightening policies to cool inflation, which has hit levels significantly above central banks’ objectives. In Canada, the level of headline inflation was running at 6.3% at year-end, well above the Bank of Canada’s 1-3% target range. There are increasing signs, however, that inflation has peaked in many major economies, including Canada. We believe central bank policy rates are nearing the terminal point of this current cycle.
Generally, developed economies remain resilient, largely due to strong labour market fundamentals and accumulated household savings. Meanwhile, with China reopening its economy after removing strict COVID-19 measures, and India continuing to register the fastest growth rate among major countries, emerging markets are expected to be a positive source of growth in 2023.
As the global economy adapts to a higher interest rate environment, we believe growth should slow but not collapse. Following this adjustment period – which we estimate could last about a year – we forecast growth to pick up again in 2024. This will provide an environment for company earnings to increase. Over the next 3-5 years, we expect equity market returns to average around 7% per year, which includes 2% coming from dividends.
Meanwhile, as economic activity picks up and inflation slows in the years ahead, the prospects for bonds are less attractive. After 2023, we expect the Canadian economy to grow by 2.0-3.0% per year in real terms and inflation to average 2.0% annually. This suggests that a fair value for medium- to long-term bond yields going forward should be about 4.5%, higher than current levels. As a result, we continue to avoid longer-dated instruments to protect against capital losses from higher rates. Overall, we think that the bond market will incur capital losses of about 1% per year over the next 3-5 years, which will be offset by interest payments of about 5% per year, giving a total return of 4%, or 3% lower than equity.
There are various ways to add return in fixed income markets. While we do not believe that the risk/reward is attractive for longer-term bonds, one area where we do see attractive prospects is in the short-to-medium term corporate bond market. As economic activity is slowing and many market participants are fearful that the global economy will enter a recession, corporate bond spreads have widened to levels only experienced during recessions. Given our positive medium-term outlook for the economy, we believe too much pessimism may have been priced in. Our analysis of the credit risk of specific issuers has led us to conclude that the risk/reward in these bonds is quite interesting.
Equity Market –
Forecasted Returns
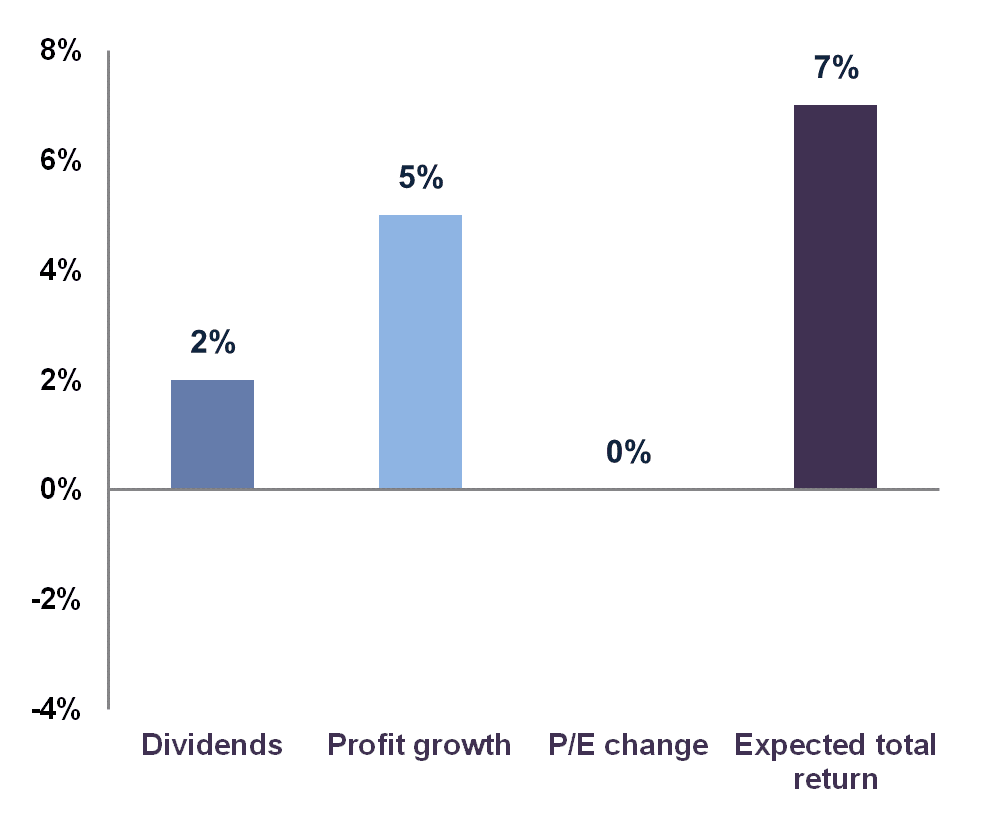
Source: Letko Brosseau forecast for average total returns for global equities index over a 3-5 year horizon.
Fixed Income Market –
Forecasted Returns
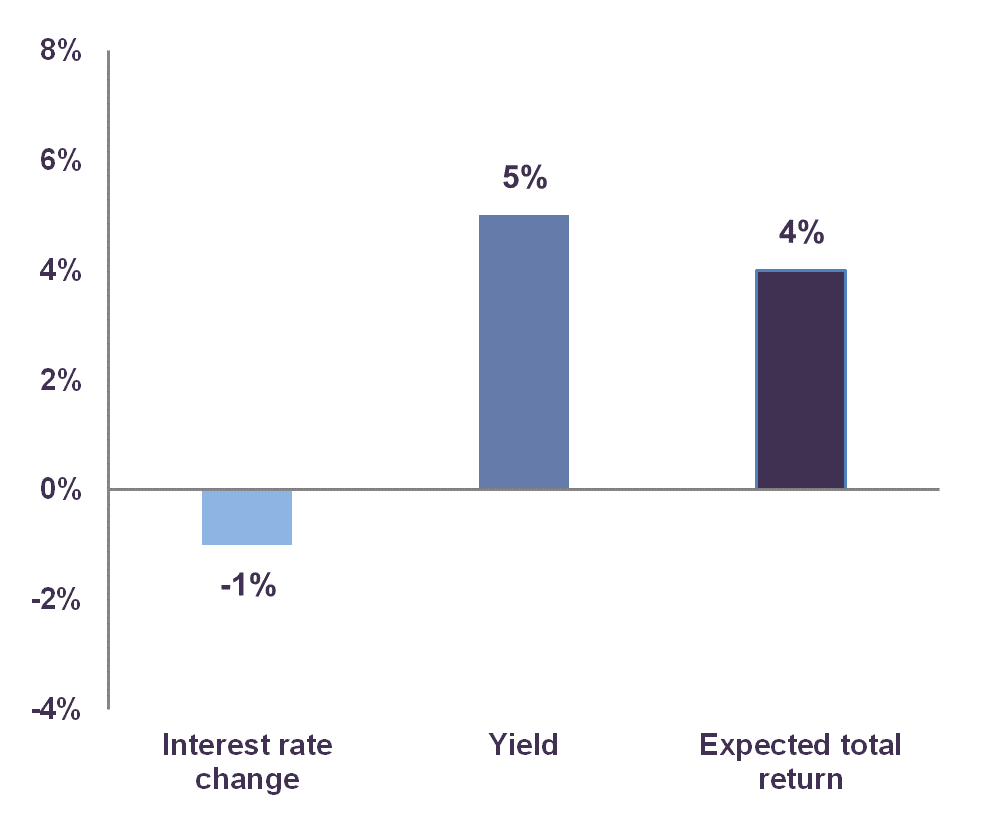
Source: Letko Brosseau forecast for average total returns for fixed income index over a 3-5 year horizon.
As an example, during the fourth quarter of 2022, a 5-year bond of Bell Canada, an issuer with good earnings prospects and a strong balance sheet, has yielded up to 5.6%, or 185 bps above a federal government bond of the same maturity. Meanwhile, in the real estate space, credit spreads have offered even better prospects. One might well question whether an interest rate sensitive industry like real estate is the right place to allocate capital at present. But this is where detailed fundamental work tends to pay off. Credit spreads of companies like Smart Centres REIT, a retail-focused real estate investment trust with Walmart as an anchor tenant, very long lease terms and high occupancy, have increased like the rest of the industry. However, the company’s growth prospects and solid balance sheet suggest that the risk of default is extremely limited. A 5-year bond of Smart Centres REIT has yielded up to 6.2%, or 245 bps above a federal government bond of the same maturity.
Over the recent months, we took advantage of these opportunities to increase our weight in corporate bonds, which we believe is a strategy that will pay off and add value over time.
On balance, we remain of the view that carefully selected stocks will outperform cash, bonds and GICs over the medium-term. While bonds appear more attractive than a year ago, we still do not think that the interest-rate risk is sufficiently rewarded to prompt a move into long-dated instruments, nor do we believe that fixed income prospects are higher than those of equities.
Conclusion
History shows that most investment managers do not achieve their objective of outperforming their respective benchmark over the long term. Through our investing principles of fundamental analysis, price sensitivity, and using a risk/reward approach, Letko Brosseau has been able to achieve this difficult objective. Over the short-, medium- and long-term, our portfolios have generated enviable attractive absolute returns and added significant value in relation to their benchmarks.
One area where this approach has delivered significant outperformance is in the fixed income market. Though we acknowledge that falling behind the pack for a stretch was hardly pleasant, remaining true to our investing principles while focusing on the long-term did prove to be the best investing strategy.
As we continue to uphold these principles and abide by this holistic approach, we remain confident that our investment strategy will continue to add value over time.
1 SPIVA® Institutional Scorecard (https://www.spglobal.com/spdji/en/documents/spiva/research-spiva-institutional-scorecard-year-end-2021.pdf)
2 eVestment (evestment.com), information collected directly from investment management firms by eVestment with their agreement. Individual ranking provided by eVestment on the Canadian Core Fixed Income Universe, gross returns, across 48 firms and 67 unique strategies as of December 31, 2022. More information can be provided upon request.
3 eVestment (evestment.com), information collected directly from investment management firms by eVestment with their agreement. Individual ranking provided by eVestment on the All Global Balanced / TAA Universe, gross returns, across 219 firms and 542 unique strategies as of December 31, 2022. More information can be provided upon request.
4 Value added of asset allocation over 4 years based on the Brinson-Hood-Beebower performance attribution method.
Legal notes
Composite and benchmarks information:
The Global Balanced (Canadian Bias) Composite includes all discretionary balanced mandates with a bias towards Canadian equities and asset mix targets within the ranges of 30-70% for fixed income and 30-70% for global equities. The Composite assets as of December 31, 2022 were $4.0 billion or 24.4% of assets under management.
The benchmark of the Composite is 5% FTSE Canada 91 Day T-Bill Total Return Index, 40% FTSE Canada Universe Bond Total Return Index, 20% S&P/TSX Composite Total Return Capped Index and 35% MSCI All Country World Total Return Net Index. The benchmark from June 1, 2007 to December 31, 2017 was 5% FTSE Canada 91 Day T-Bill Total Return Index, 40% FTSE Canada Universe Bond Total Return Index, 20% S&P/TSX Composite Total Return Capped Index and 35% MSCI World Total Return Net Index. The benchmark from January 1, 2001 to May 31, 2007 was 5% FTSE Canada 91 Day T-Bill Total Return Index, 40% FTSE Canada Universe Bond Total Return Index, 30% S&P/TSX Composite Total Return Capped Index (formerly TSE 300 Composite Total Return Capped Index) and 25% MSCI World Total Return Net Index. The benchmark since inception to December 31, 2000 was 5% FTSE Canada 91 Day T-Bill Total Return Index, 40% FTSE Canada Universe Bond Total Return Index, 35% TSE 300 Composite Total Return Index adjusted to cap the weighting of any associated group of equities at 10% of the index and 20% MSCI World Total Return Net Index.
The benchmark of the bond segment of the Composite is 100% FTSE Canada Universe Bond Total Return Index.
The benchmark of the equity segment of the Composite is 36.4% S&P/TSX Composite Total Return Capped Index and 63.6% MSCI All Country World Total Return Net Index. The benchmark from June 1, 2007 to December 31, 2017 was 36.4% S&P/TSX Composite Total Return Capped Index and 63.6% MSCI World Total Return Net Index. The benchmark from January 1, 2001 to May 31, 2007 was 54.5% S&P/TSX Composite Total Return Capped Index (formerly TSE 300 Composite Total Return Capped Index) and 45.5% MSCI World Total Return Net Index. The benchmark since inception to December 31, 2000 was 63.6% TSE 300 Composite Total Return Index adjusted to cap the weighting of any associated group of equities at 10% of the index and 36.4% MSCI World Total Return Net Index.
Performance results reflect the reinvestment of dividends, income and other earnings and are presented net of all foreign withholding taxes. Reclaimable withholding tax refunds are recognized when received. The benchmark is fully invested and its returns include the reinvestment of dividends, income and other earnings and are presented net of withholding taxes. Performance results are presented before management and custodial fees but after trading commissions.
The information and opinions expressed herein are provided for informational purposes only, are subject to change and are not intended to provide, and should not be relied upon for, accounting, legal or tax advice or investment recommendations. Any companies mentioned herein are for illustrative purposes only and are not considered to be a recommendation to buy or sell. It should not be assumed that an investment in these companies was or would be profitable. Unless otherwise indicated, information included herein is presented as of the dates indicated. While the information presented herein is believed to be accurate at the time it is prepared, Letko, Brosseau & Associates Inc. cannot give any assurance that it is accurate, complete and current at all times.
Where the information contained in this presentation has been obtained or derived from third-party sources, the information is from sources believed to be reliable, but the firm has not independently verified such information. No representation or warranty is provided in relation to the accuracy, correctness, completeness or reliability of such information. Any opinions or estimates contained herein constitute our judgment as of this date and are subject to change without notice.
Past performance is not a guarantee of future returns. All investments pose the risk of loss and there is no guarantee that any of the benefits expressed herein will be achieved or realized.
The information provided herein does not constitute investment advice and it should not be relied on as such. It should not be considered a solicitation to buy or an offer to sell a security. It does not take into account any investor’s particular investment objectives, strategies, tax status or investment horizon. There is no representation or warranty as to the current accuracy of, nor liability for, decisions based on such information.
This presentation may contain certain forward-looking statements which reflect our current expectations or forecasts of future events concerning the economy, market changes and trends. Forward-looking statements are inherently subject to, among other things, risks, uncertainties and assumptions regarding currencies, economic growth, current and expected conditions, and other factors that are believed to be appropriate in the circumstances which could cause actual events, results, performance or prospects to differ materially from those expressed in, or implied by, these forward-looking statements. Readers are cautioned not to place undue reliance on these forward-looking statements.
Concerned about your portfolio?
Subscribe to Letko Brosseau’s newsletter and other publications: