 Canada - FR
 U.S. - EN
Overview:
- A resurgence of trade tensions brought fears of a global recession to the forefront of investor concerns during the second quarter. We believe such fears remain unfounded.
- Global economic activity is slowing modestly, as anticipated, but not collapsing. Central banks are maintaining loose monetary policies and fiscal conditions are stimulative.
The IMF forecasts global real GDP will grow by 3.3% in 2019. - Solid consumer and business spending are driving the U.S. economy. We forecast real GDP to expand by 2.0-2.5%
in 2019. - A sluggish energy sector and a softer housing market are weighing on Canadian economic activity. We expect real GDP growth of 1.5% as loose fiscal and monetary policy as well as a sound labour market provide a positive economic backdrop.
- Trade uncertainty continues to impact the Eurozone as growth is slowing for most of the major economies in the region.
Our outlook for real GDP growth in 2019 is 1.0-1.5%. - Emerging market growth is moderating, albeit to still impressive levels of activity. Real GDP for the region is forecast to expand by 4.4% in 2019, more than twice the growth rate of the developed world.
- We believe stock prices, particularly for cyclically-sensitive sectors, continue to reflect too much pessimism on trade and growth. We expect a higher return from owning stocks compared to bonds and cash in the medium-term as macroeconomic concerns recede.
Fears of a global recession triggered by renewed trade tensions destabilized markets in the second quarter.
Our reading of current data suggests that global activity is slowing modestly, as anticipated, but not collapsing. We believe the balance of risks tilt the world economy towards continued growth, not recession.
The global economy is primed for growth
If one abstracts from the uncertainty created by politically driven trade tensions, none of the factors that typically put the brakes on growth are in place. There are no excessive economic imbalances or distortions in financial markets and inflation is subdued. In fact, inflation remains muted in all developed markets and most emerging economies, which is allowing global central banks to maintain loose monetary policies. In turn, this is supporting credit growth and, more generally, economic activity. Global fiscal conditions are also loose and stimulative to economic growth.
As a result, across the world, job markets are healthy, wage growth is modest but positive and household income is growing steadily. Confidence levels remain solid and generally strong asset prices are having a positive impact on consumers’ net worth. The IMF forecasts that global real GDP will rise by 3.3% in 2019, a moderate decline from the 3.6% pace recorded in 2018.
The U.S. is more resilient than investors are discounting
In the U.S., real GDP expanded 3.2% year-on-year in the first quarter. A strong job market provided the backdrop for a continued rise in household spending. An average of 151,000 jobs per month were created in the three months to May and the unemployment rate reached 3.6%, its lowest level since 1953. Disposable income expanded by 3.9% year-over-year in May, helped by a 3.1% rise in hourly earnings. The savings rate remains elevated at 6.1%, highlighting the healthy state of U.S. consumer balance sheets.
Business investment grew 6.9% year-over-year in nominal terms in Q1, helped by a strong 10.8% increase in R&D and software spending. Investment in machinery and equipment grew a modest 3.9% year-on-year in Q1 as low oil prices weighed on energy investments. Capital spending in other industries grew steadily, with investment in agricultural machinery up 14.4%, construction machinery 8.6%, transportation equipment 6.0%, and medical equipment 4.4%. During the same period, domestic profits expanded by 4.0%, which should support a continued increase in business investment in the quarters ahead.
On the housing front, an average annualized 1.2 million homes were built during the three months to May, a rate that is below the trend in household formation. In the last 12 months to March, 2.5 million new households were formed, more than twice the level of new homes constructed. The residential homeowner vacancy rate reached its lowest level since the early 1990s in March. In May, the average sales price for new and existing houses was up 1.2% and 3.4% respectively versus a year ago. As pent-up demand continues to build in the housing market, residential investments should positively contribute to growth in the coming quarters.
Loose fiscal policy is also supporting economic activity. Government spending expanded by 4.3% in Q1 against a year ago and the federal deficit hit $1.1 trillion, or 5.2% of GDP. For the first time in three years, trade contributed positively to growth. The trade deficit improved to $607 billion, from $639 billion a year ago. Exports grew 3.0% while imports expanded 1.3%.
We forecast the U.S. economy will expand 2.0-2.5% in 2019, moderating from 2.9% in 2018.
Canada hits a soft patch
Weak oil prices took a toll on the Canadian economy in Q1. Real GDP growth slowed to 1.3% year-on-year, down from 1.9% for the full year 2018. Business investments contracted by 1.2% year-on-year in nominal terms due to a drag from the energy sector, as spending on structures declined by 5.9%. In contrast, investments in machinery and equipment grew 9.7% year-on-year during the first quarter.
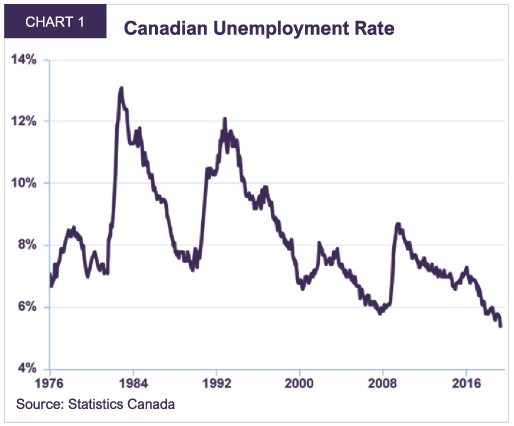
The Canadian jobs market remained buoyant. In the 12 months to May, 453,000 jobs were created, and the unemployment rate hit a 43-year low of 5.4% (Chart 1). This supported household consumption, which grew 3.5% in nominal terms during the first quarter against a year ago. Fiscal policy also boosted growth as government spending expanded by 4.3%.
The housing market continues to feel the impact of tighter mortgage standards and taxes on foreign buyers. Residential investment declined 4.0% year-on-year during Q1. Existing home sales show a mixed regional picture. Sales in May were down 8.5% year-on-year in Vancouver, but up 26.6% in Toronto and 7.5% in Montreal (for April).
Given the uncertainty with respect to the ratification of the United States-Mexico-Canada Agreement (USMCA), net trade continued to be a drag on growth. The total trade deficit increased to $61 billion in Q1 from $55 billion a year ago.
Our forecast for the Canadian economy is for 1.5% real GDP growth in 2019 as a weak energy sector is offset by loose fiscal and monetary policy and a healthy job market.
European growth remains sluggish
Trade uncertainty impacted Eurozone economic activity. Real GDP expanded by a modest 1.2% in Q1 against a year ago as the trade surplus dropped €12 billion to €126 billion. In nominal terms, exports grew 4.6% while imports expanded by 6.1%. Growth slowed in most major European countries. Real GDP was up 0.7% year-on-year in Germany, 1.2% in France, 2.4% in Spain and down 0.1% in Italy.
The domestic economy showed some signs of resilience. Eurozone household spending grew 2.6% in nominal terms, business investment, 7.3%, residential investment 7.3% and government spending 3.0%.
We expect the Eurozone economy to expand by 1.0-1.5% in 2019 while the U.K. is forecast to grow 1.2%.
Pro-growth policies stimulating emerging market growth
Emerging market growth is moderating from 2018 levels, but the overall rate of activity remains impressive. During Q1, China’s economy advanced 6.4% in real terms against a year ago. Despite continued trade tensions, we expect China to achieve growth of 6.3% in 2019 against a backdrop of accommodative fiscal and monetary policies.

Similarly, policymakers in India are bolstering fiscal and monetary measures. In Q1, India recorded real GDP growth of 5.8% in year-on-year terms, driven by strong consumption and government spending. With three rate cuts so far in 2019, the policy interest rate now sits at its lowest level in nine years. The IMF forecasts India to grow by 7.3% in 2019.
Elsewhere, growth across Southeast Asia remains solid. In the first quarter, real GDP in the Philippines increased by 5.6% against a year ago, Indonesia 5.1% and Malaysia 4.5%. During Q2, both the Central Bank of the Philippines and the Central Bank of Malaysia joined the growing list of emerging market monetary authorities pursing pro-growth policies.
The economic growth differential between emerging markets and the developed world remains sizeable (Chart 2). Emerging markets’ real GDP is forecast to expand by 4.4% in 2019, more than twice the rate of the developed world.
Risk to LBA forecast: the domino effects of a protracted trade war or other policy accident
In our view, a recession forecast is anchored less on current fundamentals and more on speculation that a negative event will have an adverse impact on the business climate and, ultimately, growth. Market volatility has therefore been driven by sentiment that a Trump administration policy accident will tip a slowing economy into recession.
A drawn-out trade war could be such a destabilizing event. On May 5th, the U.S. announced it would raise tariffs from 10% to 25% on $200 billion of Chinese imports. China subsequently retaliated by raising their tariffs on $60 billion of American imports. This represented an abrupt turn in trade negotiations, which until then seemed to be heading towards resolution. Though there has been much speculation relating to the reason for the breakdown of a deal, Chinese government subsidies and intellectual property theft remain contentious issues.
Even if one accepts that a resolution to the trade conflict is either several months away or unlikely, it is premature to forecast recession. The direct economic impact of the tariffs on the U.S. and China is likely to be muted as they account for only 0.2% of U.S. GDP and 0.3% of China’s GDP. The indirect effect of escalating trade tensions is more difficult to quantify. It requires estimates of how a climate of uncertainty spills over to lower business spending and whether the resulting domino effects significantly impair economic growth.
For example, despite the uncertainty surrounding Brexit, U.K. business investment slowed but did not contract, nor did the domestic economy fall into recession. Capital spending growth averaged 3.8% during June 2014-June 2016, the two years leading up to the vote to leave the European Union. Since then, business investment has slowed to 3.3% and real GDP is forecast to grow 1.2% in 2019.
The fact that China and the U.S. are still negotiating is encouraging. We continue to believe that both countries share a community of interests which argues for a positive outcome to the trade dispute. Simply put, China needs
growth to improve the standard of living of its population and the U.S. is China’s largest customer, importing $560 billion of goods and services. Meanwhile, according to 2016 data from the U.S. Bureau of Economic Analysis, American companies generated $345 billion in sales, $26 billion in profits and controlled $405 billion in assets in China. Though no real economic pain has yet been felt by either economy, the threat is rising. Furthermore, with a president that is focused on growth and his own reelection in 2020, there is a strong incentive for the Trump administration to clinch an agreement.
Balancing the risk of recession with the risk of NO recession
History suggests that recessions are the main destroyer of stock market value over time. The S&P 500 Index declined by 29% on average from peak to trough during the 11 recessions following World War II. Since the Q4 2018 stock market sell-off, companies that are more sensitive to the economic cycle have lagged in performance relative to defensive sectors. For example, many oil and mining stocks trade at a significant discount to their net asset value and several high-quality banks trade between 7 and 10 times 2020 earnings, well below their historical valuations. Similarly, share prices of mining companies, auto suppliers and other cyclically oriented sectors are reflecting a high degree of negative sentiment associated with the fear of an upcoming recession.
While we cannot entirely rule out such an outcome, we ascribe a low probability of a recession occurring. Our base case scenario, which we forecast with a high degree of probability, is for continued growth. As outlined above, the economic data remains consistent with moderating growth and does not signal recession. With valuations reasonable, and in some cases very inexpensive, we believe that raising cash at this point comes with a substantial opportunity cost.
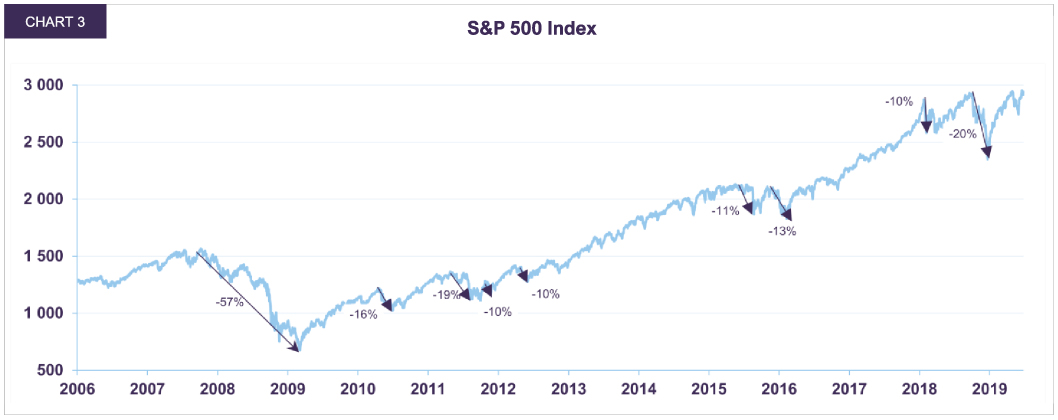
Indeed, market selloffs based on fears of recession that do not materialize can quickly give rise to huge upside. Since 2009, there have been numerous such episodes, including the European debt crisis of 2011-12, the Greek default of 2015 and the Chinese slowdown of 2015-16. The S&P 500 fell by 10% or more on a total of eight occasions since the Great Recession (Chart 3). Each time, stocks rebounded strongly once it became clear that a global recession would not ensue, rising on average 26% from trough to the next peak. More recently, between the September 2018 market high and the December 2018 trough, the S&P 500 fell 20% largely due to negative sentiment on growth, before rebounding 25% by the end of June.
The bond market also reflects pessimistic views on economic growth and inflation. The 5-year federal bond yield currently stands at 1.4%, implicitly pricing between one and two future rate cuts, while the 30-year federal yield is at 1.7%, or about the same as the Bank of Canada overnight rate. We believe expected returns on bonds in the medium-term remain too low, especially in purchasing power terms. If the 30-year bond yield went back to its level at end-September 2018, the capital loss would reach 14%. If it returned to a level consistent with the fundamentals of economic growth and inflation, losses could mount to 46%.
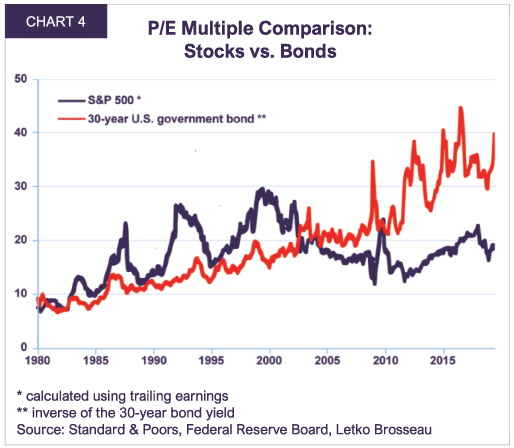
The degree of overvaluation embedded in long bonds can be measured by its “P/E ratio”. The higher the ratio of the bond’s price (P) to its annual interest payment (E), the more expensive the bond. The P/E multiple for a U.S. government 30-year bond is 40 (Chart 4). Similarly, a Canadian government long bond trades at 59 times. The comparable multiple based on trailing earnings for the S&P 500 is 19.3 and for the S&P/TSX it is 17.6. And one must remember that the interest income paid on a bond will not rise, whereas stock earnings could easily triple over the next 30 years.
In the current environment dominated by uncertainty, we believe that a prudent portfolio manager needs to weigh all risks, abstract from short-term volatility, and focus on the best strategy for the medium-term. Rather than increase the risk of our portfolio by purchasing bonds or accept a destruction of purchasing power by holding cash, we believe our equity holdings already embed a buffer against significant downside.
Our portfolio is currently trading at only 11.3X 2019 earnings, has a 3.3% dividend yield and includes many defensive stocks like telecommunications and health care companies. By taking the decision to maintain course, we are confident that patience will be greatly rewarded.
All dollar references in the text are U.S. dollar unless otherwise indicated.
This document has been prepared by Letko, Brosseau & Associates Inc. for informational purposes only and is not intended to provide, and should not be relied upon for, accounting, legal or tax advice or investment recommendations.
Where the information contained in this document has been obtained or derived from third-party sources, the information is from sources believed to be reliable, but the firm has not independently verified such information. No representation or warranty is provided in relation to the accuracy, correctness, completeness or reliability of such information. Any opinions or estimates contained herein constitute our judgment as of this date and are subject to change without notice. Past performance is not a guarantee of future returns.
This document may contain certain forward-looking statements which reflect our current expectations or forecasts of future events concerning the economy, market changes and trends. Forward-looking statements are inherently subject to, among other things, risks, uncertainties and assumptions regarding currencies, economic growth, current and expected conditions, and other factors that are believed to be appropriate in the circumstances which could cause actual events, results, performance or prospects to differ materially from those expressed in, or implied by, these forward-looking statements. Readers are cautioned not to place undue reliance on these forward-looking statements.
Concerned about your portfolio?
Subscribe to Letko Brosseau’s newsletter and other publications: