Letko Brosseau
Veuillez sélectionner votre région et votre langue pour continuer :
Please select your region and language to continue:
We use cookies
Respecting your privacy is important to us. We use cookies to personalize our content and your digital experience. Their use is also useful to us for statistical and marketing purposes. Some cookies are collected with your consent. If you would like to know more about cookies, how to prevent their installation and change your browser settings, click here.
Overview:
- Global equity markets rallied to new highs in 2019 as fears of recession receded and trade tensions eased.
- Economic activity is on track for a modest pickup in 2020. The IMF forecasts global real GDP growth will rise from 3.0%
in 2019 to 3.4% in 2020. - In the U.S., resilient domestic demand and green shoots in manufacturing contribute to our constructive outlook.
We expect real GDP to increase by 2.0-2.5% in 2020. - A robust labour market as well as positive trends in both housing and non-residential investment is boosting activity in Canada. We forecast real GDP to expand by 1.5-2.0%
in the year ahead. - The Eurozone is set to benefit from monetary easing, pro-growth fiscal policies and an improving trade environment. We anticipate Eurozone real GDP to increase by 1.0-1.5% in 2020.
- More than 40 emerging market central banks slashed interest rates in the past year. These accommodative efforts should pay dividends in 2020. Emerging market real GDP is expected to grow 4.6% in 2020.
- With the bulk of global monetary easing likely behind us, bond yields will gradually trend upwards. This puts longer maturity fixed income securities at risk of capital losses.
- Our equity portfolios offer very reasonable valuations. We continue to overweight stocks within balanced portfolios while keeping bond duration short and credit quality high.
During much of 2019, financial markets appeared to be fighting a recession that never occurred. The yield curve’s inversion, geopolitical uncertainty, slowing economic growth together with on-again, off-again trade negotiations between the U.S. and China challenged investors throughout the year.
In the October edition of LBA’s Economic and Capital Markets Outlook, we argued that investors were discounting an overly pessimistic outcome on trade and the global economy. Our assessment was that growth had slowed, but would remain positive.
There are increasing signs that the macroeconomic backdrop is improving in line with our forecast. At present, global fiscal and monetary policy is accommodative, income growth is strong, job creation remains steady and credit is abundant. Equity markets are hitting new highs as recession fears have receded. Manufacturing activity shows tentative signs of a recovery and commodity prices are rebounding. Although the US-China trade dispute remains unresolved, tensions have de-escalated as the two countries appear to be approaching a compromise. The IMF forecasts that global real GDP growth will accelerate from 3.0% in 2019 to 3.4% in 2020.
U.S. economy weathers trade headwinds
In the U.S., real GDP expanded by 2.1% year-on-year in Q3. Consumer spending was up 4.0% in nominal terms, due to healthy growth in employment and incomes. The U.S. unemployment rate fell to a multi-decade low of 3.5% as 266,000 jobs were added in November. Average hourly earnings increased 3.1% year-on-year in Q3, contributing to household disposable income growth of 4.4%. Consumer balance sheets remain in a relatively healthy state: the savings rate is 7.9% and household net worth reached 528% of GDP, a new high. We expect consumption will continue to contribute positively to U.S. economic growth in the coming quarters.
Business investment slowed to 2.5% year-over-year in nominal terms during Q3 largely due to sizable cuts in energy sector capital spending (-14.4%). Non-energy investment was up 3.5% and general business sentiment is in an upswing as trade tensions have eased. The Duke survey of CFOs suggests that private sector capital spending should rise 4.7% in the next year, a significant improvement from the survey’s Q3 result of +0.6%.
Residential investment increased a modest 1.4% year-on-year in Q3. An average annualized 1.4 million housing starts were recorded during the three months to November, well within the 1.3 – 1.5 million housing unit level consistent with long-term household formation. Easy credit conditions and low mortgage rates should continue to support housing demand going forward.
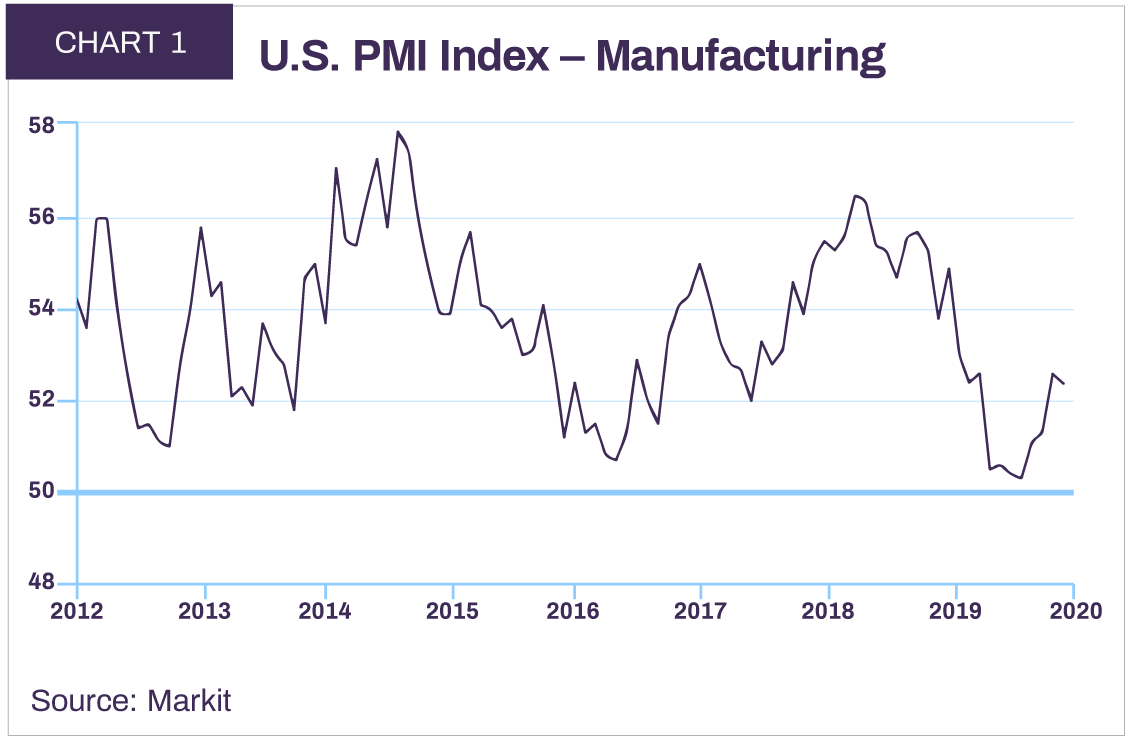
There are early signs that U.S. industrial production may be on the cusp of a rebound. The Markit Manufacturing Purchasing Managers’ Index (PMI), a leading indicator for production, came in at 52.4 in December (Chart 1). This signals an expansion of manufacturing activity as solid contributions from new orders and output components drove the improvement.
We forecast the U.S. economy will expand 2.0-2.5% in 2020 based on steady growth in consumer spending and business investment, a modest improvement in trade and an accommodative policy mix. The turmoil in U.S. domestic politics is a distraction, but is not expected to have a material impact on our forecast.
Domestic demand sustaining activity in Canada
Canadian real GDP grew 1.7% against a year ago in Q3. Lower energy prices and lingering uncertainty regarding the US-Mexico-Canada trade agreement (USMCA) exerted a drag on trade. Exports declined 0.4% in nominal terms while import growth slowed to 0.1% year-on-year. The trade deficit widened by C$4 billion to C$32 billion during the quarter.
In contrast, Canada’s domestic economy remained resilient. Consumer spending grew 3.0% year-on-year in Q3 as disposable income expanded by a robust 5.1%. Sizeable wage gains occurred across a variety of sectors in November: average hourly earnings increased 6.6% in construction, 4.3% in manufacturing and 6.2% in finance, insurance, real estate and leasing. The Canadian economy created 285,000 jobs year-to-date, making 2019 one of the strongest years for job creation this decade.
Total non-residential business investment was up 4.4% in Q3 against a year ago. Strong investment in the Canadian industrial sector is one of several indicators pointing to a manufacturing rebound. Following two years of negative growth, manufacturing sales of autos and parts were up 3.9% year-over-year in October. In December, Markit’s Manufacturing PMI signalled a fourth consecutive increase in factory activity.
Housing turned positive in Q3, rising 3.0% year-over-year as lower mortgage rates helped drive an improvement in new construction. In the three months to November, new home sales increased 11.3% against a year ago while the average price rose 5.6%.
As these favourable trends continue, we forecast Canada’s real GDP will increase by 1.5-2.0% in 2020.
Europe to remain broadly stable
Eurozone economic growth held steady in Q3. Real GDP advanced by 1.2% year-on-year for a second consecutive quarter. Export-focused economies fared less well than those more reliant on internal sources of demand. Real GDP grew a healthy 1.9% year-on-year in Spain and 1.4% in France, while expanding by 0.5% in Germany and 0.3% in Italy.
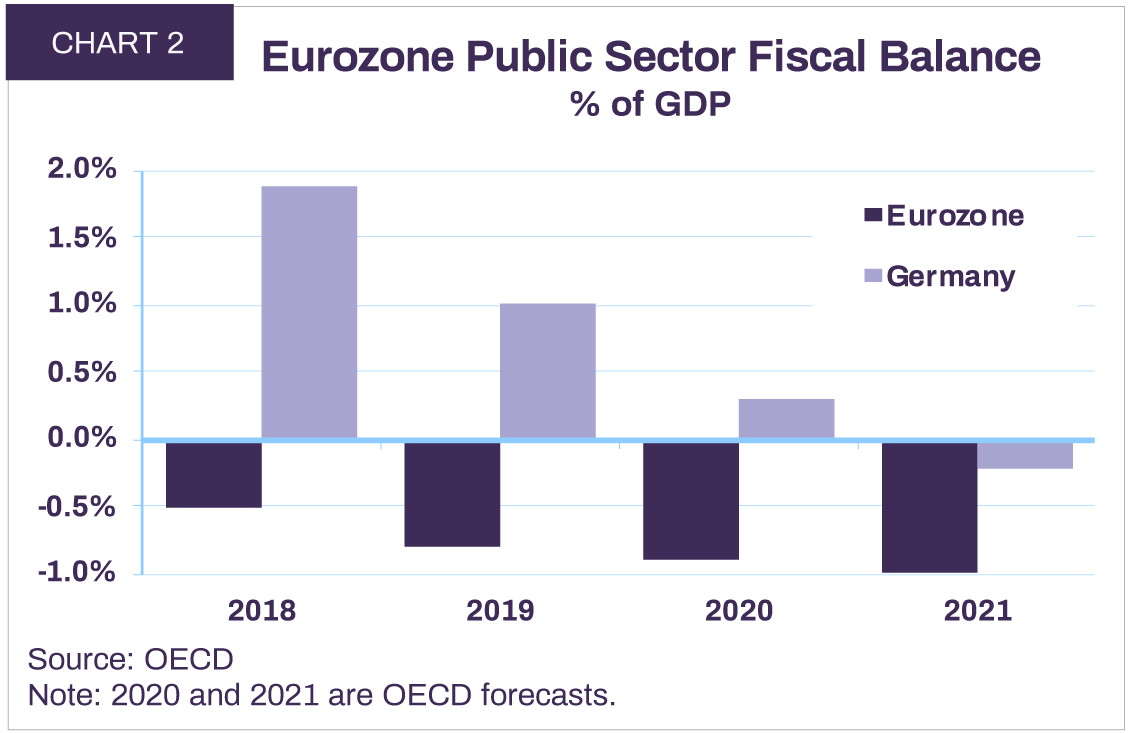
Domestic activity was solid across Europe. Eurozone household spending increased 2.8%, business investment 11.0% and residential investment 6.3% in nominal terms during Q3. A broad-based easing is underway in the Eurozone and pro-growth fiscal budgets have been tabled for 2020 (Chart 2). Even the fiscally prudent German government is expected to boost spending to support the economy.
The Eurozone’s trade surplus narrowed to €103.6 billion in Q3 due to weaker export demand and a rise in import volumes. A general easing of trade tensions should help boost activity in the region. We expect Eurozone real GDP will increase by 1.0-1.5% in 2020.
The environment of uncertainty related to the 2016 Brexit referendum continued to weigh on U.K. investment and domestic demand. Real GDP was up 1.1% year-on-year in Q3, its weakest rate of growth since 2012. The election of a majority Conservative government on November 30th resolves parliamentary gridlock and reiterates the country’s intent to leave the European Union. Although this increases the odds of a “hard exit” – an exit with no deal on customs, security and other cross-border issues – we continue to believe that any negative economic fallout will be felt by the U.K. rather than Europe.
The IMF forecasts U.K. growth of 1.4% in 2020, a modest improvement from 2019 levels.
Emerging markets main driver for global growth
While activity in the emerging markets slowed in Q3, the region is primed for a significant pick-up in 2020. Central banks from Latin America to Southeast Asia have aggressively cut interest rates and governments are pursuing expansionary fiscal policies.
During the third quarter, China’s economy grew 6.0% year-on-year in real terms. The Caixin Manufacturing PMI remained in expansionary territory, hitting 51.5 in December. Policy is accommodative, as government authorities continue to implement reforms and measures aimed at supporting activity. We expect China’s real GDP will expand by 5.8% in 2020.
Real GDP growth in India slowed to 4.5% in Q3 against a year ago. This downshift in activity is largely due to a domestic credit squeeze. Private banks’ heightened perception of risk is compounding challenges faced by the non-bank financial sector during a time when the market is adapting to public sector banking reforms. As these issues are resolved, the IMF forecasts economic growth will rebound to 7.0% in 2020, boosted by loose monetary and fiscal policy.
On balance, emerging markets’ real GDP growth is expected to increase from 3.9% in 2019 to 4.6% in 2020. The developing world is expected to be the main driver for global growth.
Commodity prices in a turnaround
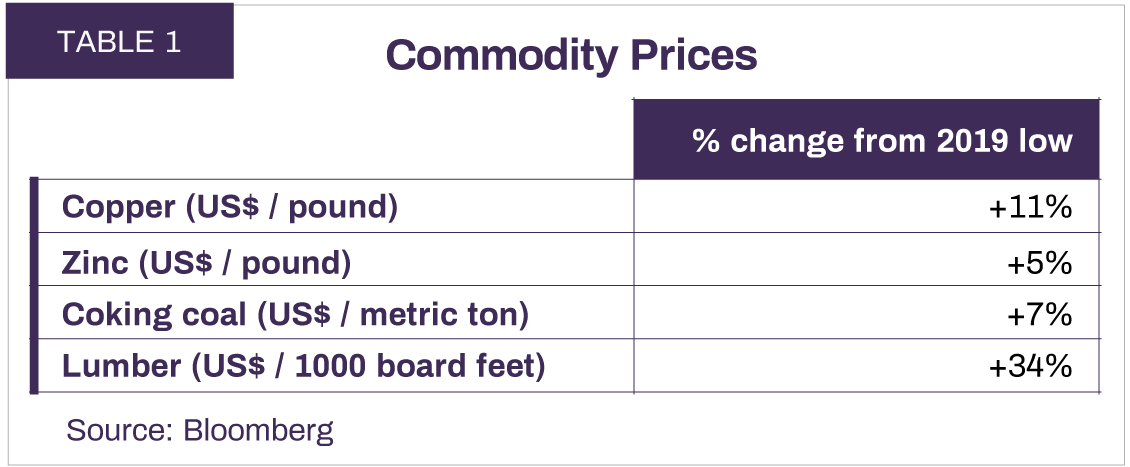
Weaker demand and fear of a global downturn weighed heavily on prices for most major commodities in the past year. However, an easing of recession concerns in the latter half of 2019 contributed to firmer prices. Copper, zinc, coking coal and lumber have all made gains from their 2019 lows (Table 1). As global activity continues to strengthen, these pricing trends should continue.
In the oil market, we see early indications of a tightening of the global supply/demand balance for the commodity, even without accounting for potential geopolitical disruption to supply. This should provide support for prices, especially beyond 2020.
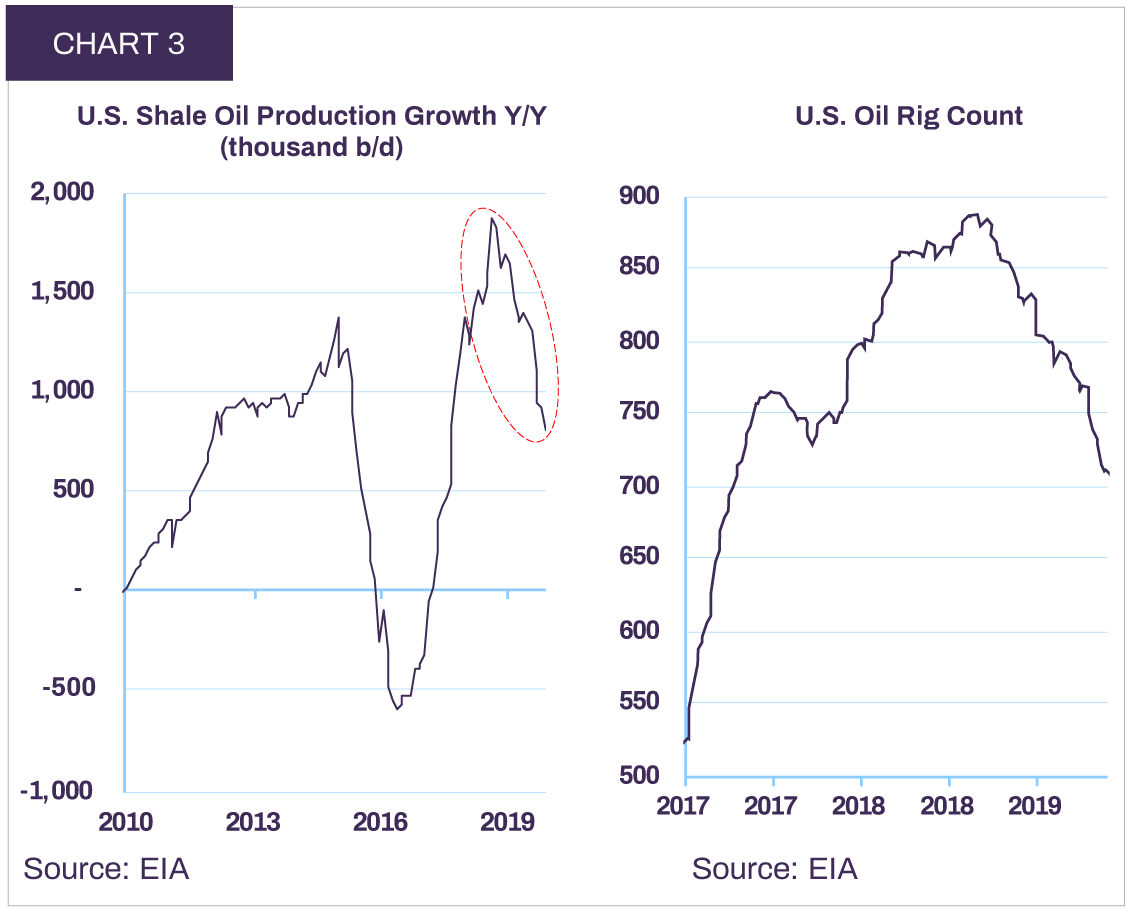
Multiple years of capital expenditure cuts have dramatically slowed the pace of major new oil project approvals. This is setting the stage for slower future supply growth. In addition, U.S. producers have struggled to raise external capital amid an environment of weaker oil prices and investor flight from the energy sector. The U.S. land oil rig count has declined 25% over the past year, signalling a protracted slowdown in the rate of domestic production growth (Chart 3).
Meanwhile, OPEC’s early December agreement to deepen production cuts by 0.5 million barrels per day points to the cartel’s continued resolve to maintain a floor on prices. According to the IMF, Saudi Arabia needs a $78 oil price to avoid running a fiscal deficit and the other OPEC countries similarly need high prices to avoid massive cuts to social spending. In addition, the recent IPO of Saudi Aramco has likely put intense pressure on the Kingdom to maintain the company’s share price. We expect any signal of oversupply to be met with extensions or a further deepening of production cuts.
With the world economy expected to accelerate, we forecast demand for oil to grow by 1.3 million barrels per day in 2020. Given the improving supply/demand dynamic, we expect WTI to trend above its 2019 level of $57 this year, converging to a medium-term equilibrium of $70. We forecast the WTI-WCS differential to average around $15 in the medium-term.
Equity markets reach new highs but valuations remain reasonable
During the fourth quarter of 2018, global equity markets sold off sharply on recession concerns. One year later, markets have reached new highs as these same concerns receded. As we noted in the July 2019 Economic and Capital Markets Outlook, “market selloffs based on fears of recession that do not materialize can quickly give rise to huge upside”.
The total return (in Canadian dollars) in 2019 for the
S&P 500 was +25.2%; S&P/TSX +22.9%; DAX +17.1%;
FTSE-100 +16.0%; Nikkei +17.2%; and the MSCI Emerging Markets Index +13.2%. On balance, equity valuations remain reasonable. The S&P 500 is priced at 16.8 times (x) expected 2020 earnings; S&P/TSX 14.0x; Bloomberg Euro 500 14.0x; and MSCI Emerging Markets 11.7x. Our global equity portfolio is valued at an attractive multiple of 11.8x 2020 earnings. In emerging markets, our holdings are priced at 8.5x, offering investors an inexpensive way to participate in the opportunities offered by these high-growth economies.
In 2019, the world’s three major central banks (the Federal Reserve, the European Central Bank and the Bank of Japan) were simultaneously buying bonds in the open market. This had a profound impact on interest rates. The yield on the U.S. 30-year Treasury hit a new historical low of 1.95% in August, on par with the level reached during World War 2 (Chart 4).
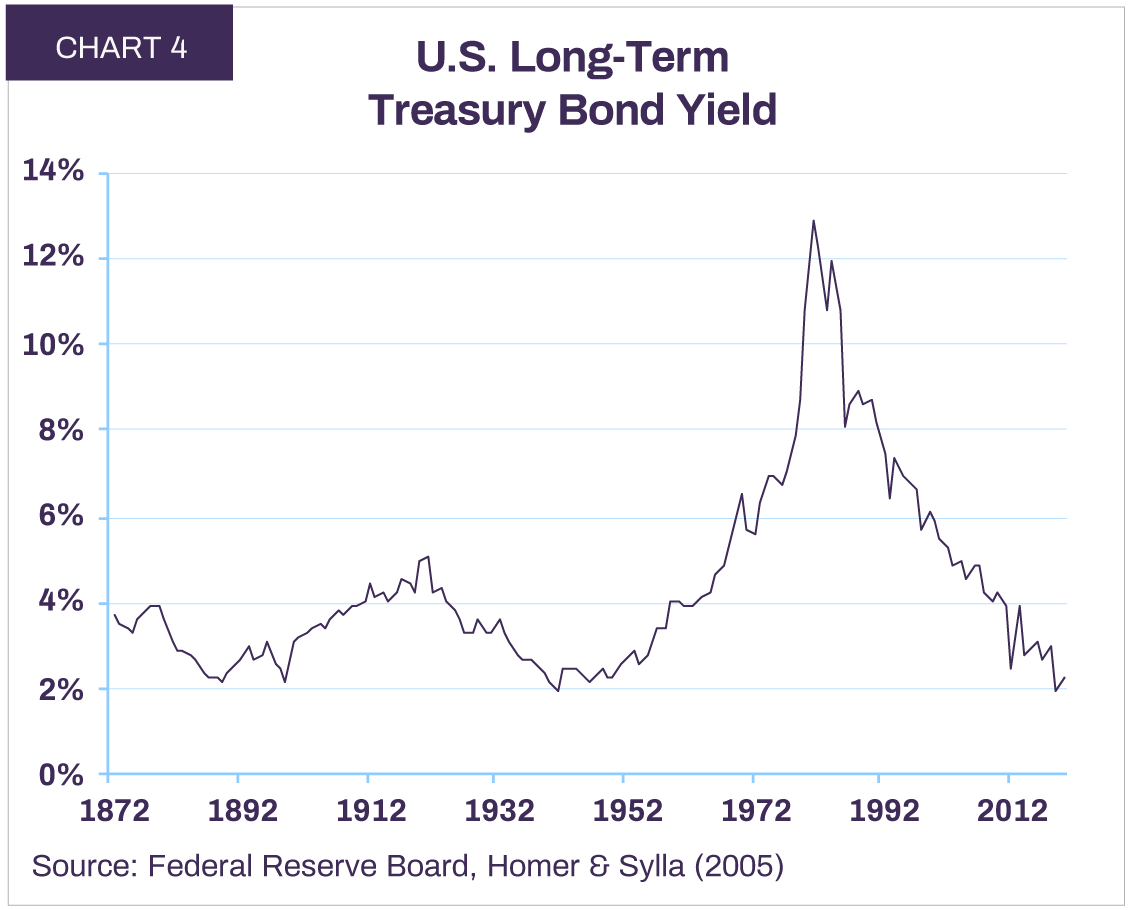
Interest rates subsequently rose during the fourth quarter on the back of improved confidence in global growth. As fears of a global recession receded, the 10-year Canadian Federal bond yield jumped from 1.36% at the end of Q3 to 1.70% at year-end. In the U.S., the 10-year yield rose by 25 basis points over the same time period. These relatively small movements in yield translated into a 2.2% loss for the Canadian federal 10-year bond and a 2.6% loss for the 30-year bond. Global long-term bonds trade on average at above 50 times income with no prospect for growth over the next 30 years.
While monetary conditions are set to remain accommodative even as economic activity improves in 2020, the bulk of policy easing is likely behind us.
We expect yields to gradually normalize to higher levels, making long-term bonds an unappealing investment.
The risk/reward trade-off continues to favour equities. We are therefore maintaining an above-target exposure to stocks within balanced portfolios. Our fixed income strategy is to keep duration short and invest in high credit quality securities.
Wishing you a healthy and prosperous New Year.

The Letko Brosseau Team
All dollar references in the text are U.S. dollar unless otherwise indicated.
This document has been prepared by Letko, Brosseau & Associates Inc. for informational purposes only and is not intended to provide, and should not be relied upon for, accounting, legal or tax advice or investment recommendations.
Where the information contained in this document has been obtained or derived from third-party sources, the information is from sources believed to be reliable, but the firm has not independently verified such information. No representation or warranty is provided in relation to the accuracy, correctness, completeness or reliability of such information. Any opinions or estimates contained herein constitute our judgment as of this date and are subject to change without notice. Past performance is not a guarantee of future returns.
This document may contain certain forward-looking statements which reflect our current expectations or forecasts of future events concerning the economy, market changes and trends. Forward-looking statements are inherently subject to, among other things, risks, uncertainties and assumptions regarding currencies, economic growth, current and expected conditions, and other factors that are believed to be appropriate in the circumstances which could cause actual events, results, performance or prospects to differ materially from those expressed in, or implied by, these forward-looking statements. Readers are cautioned not to place undue reliance on these forward-looking statements.
Concerned about your portfolio?
Subscribe to Letko Brosseau’s newsletter and other publications:
Functional|Fonctionnel Always active
Preferences
Statistics|Statistiques
Marketing|Marketing
|Nous utilisons des témoins de connexion (cookies) pour personnaliser nos contenus et votre expérience numérique. Leur usage nous est aussi utile à des fins de statistiques et de marketing. Cliquez sur les différentes catégories de cookies pour obtenir plus de détails sur chacune d’elles ou cliquez ici pour voir la liste complète.
Functional|Fonctionnel Always active
Preferences
Statistics|Statistiques
Marketing|Marketing
Start a conversation with one of our Directors, Investment Services, a Letko Brosseau Partner who is experienced at working with high net worth private clients.
Asset Alocation English
 Canada - FR
 U.S. - EN