 Canada - FR
 U.S. - EN
Portfolio Update
April 2026
Energy prices and financial markets continue to adjust to an increasingly uncertain geopolitical backdrop following the escalation of the Middle East conflict. The price of Brent and West Texas Intermediate (WTI) exceeded $100 per barrel, as of April 7th, as investors factored in the potential for a prolonged supply disruption.
While the conflict has weighed negatively on market sentiment and contributed to higher energy costs, the ultimate impact on global economic activity remains uncertain, given the unknown duration and scope of the war. As outlined in our latest Capital Markets and Economic Outlook, our base case is for world real GDP to advance by 3.0% in 2026, compared to 3.3% in 2025. The potential for economic and energy disruption varies across regions, as discussed in our March Portfolio Update edition.
Equity market performance has been divergent since the onset of the conflict, while bonds have provided modest stability. As of March 31st, 2026, the S&P 500 returned -2.6% (total return in Canadian dollar terms), the MSCI ACWI -1.5%, the MSCI EAFE 0.5%, the MSCI Emerging Markets 1.6%, and the S&P/TSX 3.9%. As we have long cautioned, elevated valuations and aggressive earnings expectations make equity indexes particularly sensitive to shifts in sentiment, a risk that is amplified in periods of geopolitical tension.
Energy Prices and Economic Impact
To assess the potential economic implications of the escalation of the Middle East conflict, we have examined the relationship between global oil expenditures and economic activity.
In 2025, global oil expenditure, measured as total oil demand multiplied by the nominal Brent crude price, represented approximately 2.3% of global GDP according to EIA and World Bank data, with Brent averaging $69 per barrel over the year. Oil futures markets currently imply an average Brent price of $92 per barrel for calendar year 2026. The impact from a potential 33% rise in average annual oil prices would be to increase global spending on oil by 0.8% to 3.1% of global GDP (Chart 1).
Global Oil Spending as % of GDP vs. Nominal Brent
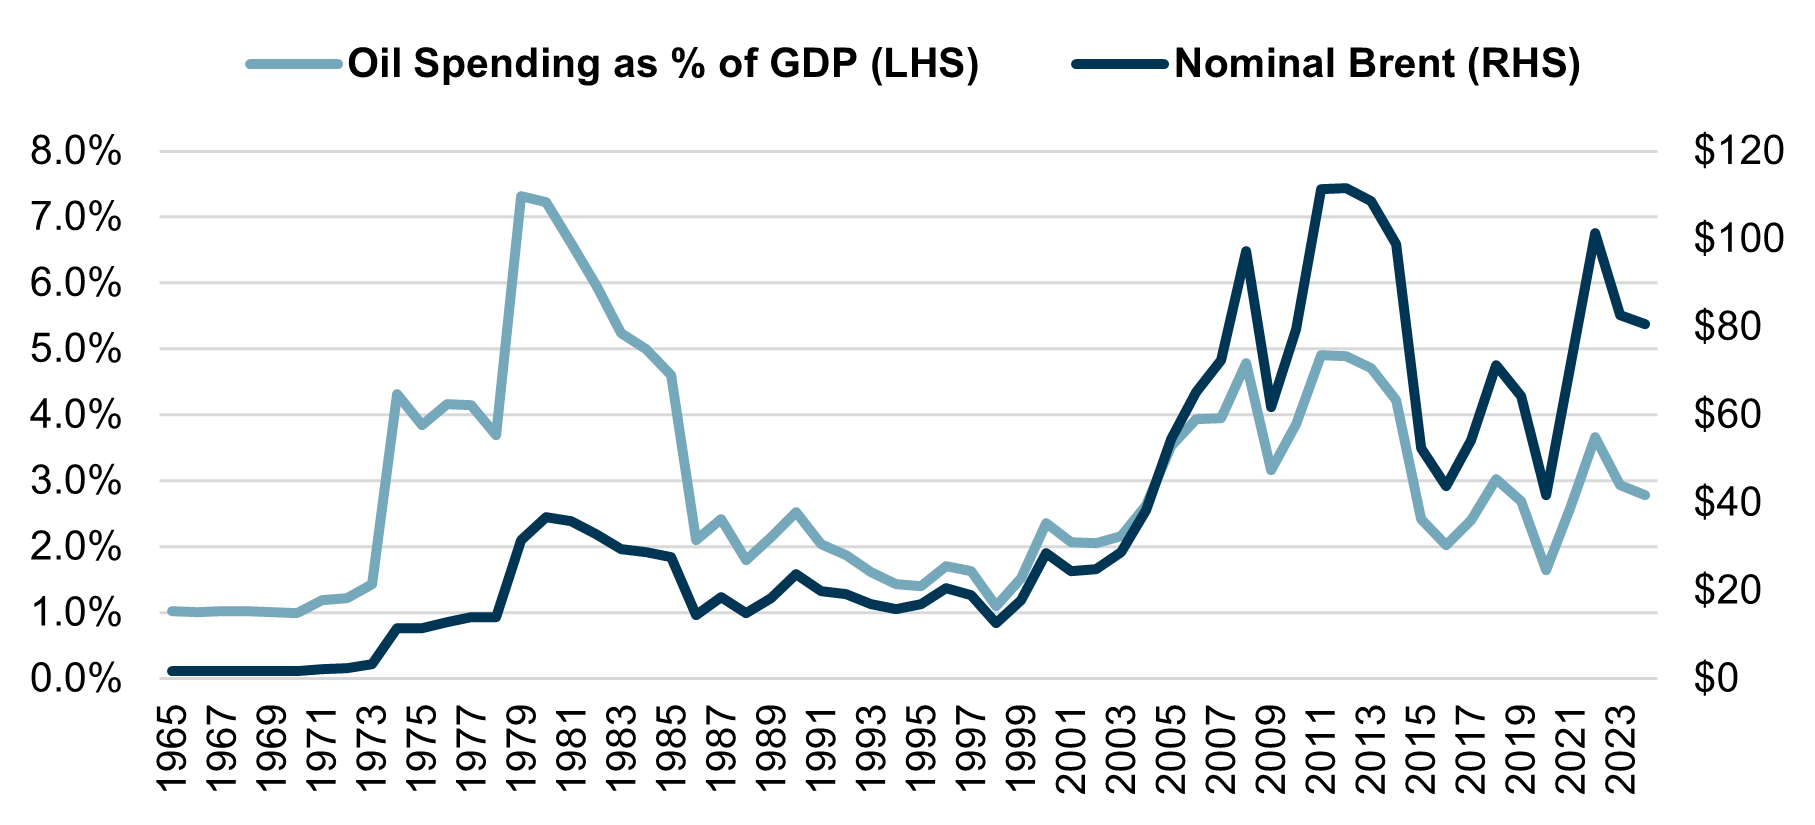
By comparison, significantly higher price levels would be required to approach historical periods of economic stress. Brent would need to sustain an annual average of $150 per barrel for the oil consumption expenditure to GDP ratio to reach the 5.0% high recorded in 2011-2012. A spike to $210 per barrel would propel the ratio to the all-time high of 7.3% achieved in 1979.
Although recent increases in oil prices are noteworthy, a more pronounced and sustained rise would be required to materially impact global growth. The effects would likely be felt most acutely in Asia, which receives approximately 85% of Middle Eastern oil exports, compared to North America, which remains largely self-sufficient in both oil and natural gas.
Portfolio Positioning
We continue to monitor company-specific developments and conduct stress testing on our holdings in light of potential risks stemming from macroeconomic and geopolitical shocks. Sectors and industries such as aviation remain a focus given their sensitivity to energy costs and demand fluctuations.
Air Canada illustrates these considerations. While futures markets do not currently anticipate a sustained period of elevated oil prices, the recent sharp increase in jet fuel prices is still significant. If jet fuel prices were to double from current levels, airlines would need to raise fares by more than 20% to fully offset the impact, which would likely dampen demand. Air Canada has hedged approximately 20% of its near-term fuel needs, providing some protection. However, we still expect near-term margin pressure driven by higher fuel costs and softer demand from higher air fares and weaker consumer confidence. At the same time, the company benefits from a strong competitive position in the Canadian market, supported by its hub network. Its Aeroplan loyalty program also contributes a more stable and higher-margin revenue stream relative to core passenger operations.
Despite these near-term headwinds, our investment thesis remains intact. The stock entered this period at a reasonable valuation and now trades at roughly 8 times 2027 consensus earnings per share as of March 31st. We continue to see a path for earnings to more than double over the next three to five years, supported by an eventual normalization in fuel prices and operating leverage driven by its fleet renewal program. The recent share price decline of approximately 20% appears to reflect a meaningful portion of these near-term pressures, and we maintain conviction over the medium to long term.
Periods of market dislocation also surface opportunities to deploy capital in high-quality businesses at attractive prices. In this context, a position was recently initiated in Microsoft. The investment was made at an attractive entry point, with the stock trading at approximately 20 times earnings, excluding non-cash gains from its OpenAI investment. Azure AI services and the rapid adoption of Microsoft 365 Copilot are expected to drive earnings growth in excess of 20% this year. By successfully integrating generative AI across its cloud infrastructure and productivity software, we believe Microsoft has established itself as one of the primary beneficiaries of the current technological cycle.
Concluding Thoughts
The severity and duration of the Middle East conflict remain highly uncertain, and the ultimate impact on economies and capital markets will depend on how energy supply disruptions evolve from here. Prolonged tensions have the potential to sustain higher energy prices and inflationary pressures, weighing on global growth and contributing to increased market volatility, with consequences that will vary across regions, industries, and asset classes.
In this environment, we consider the defensive characteristics of our portfolios to be well suited to navigate uncertainty. Our equity holdings are anchored in high-quality companies with solid fundamentals, and our bond portfolio maintains a strong credit quality. Together, these attributes position our portfolios to weather near-term volatility while remaining attentive to opportunities that may emerge as conditions evolve.
We continue to monitor events closely and will reassess our views as further information becomes available.
Where the information contained in this presentation has been obtained or derived from third-party sources, the information is from sources believed to be reliable, but the firm has not independently verified such information. No representation or warranty is provided in relation to the accuracy, correctness, completeness or reliability of such information. Any opinions or estimates contained herein constitute our judgment as of this date and are subject to change without notice.
Past performance is not a guarantee of future returns. All investments pose the risk of loss and there is no guarantee that any of the benefits expressed herein will be achieved or realized.
The information provided herein does not constitute investment advice and it should not be relied on as such. It should not be considered a solicitation to buy or an offer to sell a security. It does not take into account any investor’s particular investment objectives, strategies, tax status or investment horizon. There is no representation or warranty as to the current accuracy of, nor liability for, decisions based on such information.
Certain information contained in this document constitutes “forward-looking statements,” which can be identified by the use of forward-looking terminology such as “may,” “will,” “should,” “expect,” “anticipate,” “target,” “project,” “estimate,” “intend,” “continue” or “believe,” or the negatives thereof or other variations thereon or comparable terminology. Forward-looking statements are inherently subject to, among other things, risks, uncertainties and assumptions regarding currencies, economic growth, current and expected conditions, and other factors that are believed to be appropriate in the circumstances which could cause actual events, results, performance or prospects to differ materially from those expressed in, or implied by, these forward-looking statements. Readers are cautioned not to place undue reliance on these forward-looking statements.
The MSCI information may only be used for your internal use, may not be reproduced or redisseminated in any form and may not be used as a basis for or a component of any financial instruments or products or indices. None of the MSCI information is intended to constitute investment advice or a recommendation to make (or refrain from making) any kind of investment decision and may not be relied on as such. Historical data and analysis should not be taken as an indication or guarantee of any future performance analysis, forecast or prediction. The MSCI information is provided on an “as is” basis and the user of this information assumes the entire risk of any use made of this information. MSCI, each of its affiliates and each other person involved in or related to compiling, computing or creating any MSCI information (collectively, the “MSCI parties”) expressly disclaims all warranties (including, without limitation, any warranties of originality, accuracy, completeness, timeliness, non-infringement, merchantability and fitness for a particular purpose) with respect to this information. Without limiting any of the foregoing, in no event shall any MSCI Party have any liability for any direct, indirect, special, incidental, punitive, consequential (including, without limitation, lost profits) or any other damages. (www.msci.com).
The S&P/TSX Index is a product of S&P Dow Jones Indices LLC or its affiliates (“SPDJI”) and TSX Inc., and has been licensed for use by Letko, Brosseau & Associates Inc. Standard & Poor’s® and S&P® are registered trademarks of Standard & Poor’s Financial Services LLC (“S&P”); Dow Jones® is a registered trademark of Dow Jones Trademark Holdings LLC (“Dow Jones”); and these trademarks have been licensed for use by SPDJI and sublicensed for certain purposes by Letko, Brosseau & Associates Inc. TSX® is a registered trademark of TSX Inc., and have been licensed for use by SPDJI and Letko, Brosseau & Associates Inc. Letko, Brosseau & Associates Inc.’s product is not sponsored, endorsed, sold or promoted by SPDJI, Dow Jones, S&P, their respective affiliates, or Bloomberg and none of such parties make any representation regarding the advisability of investing in such product(s) nor do they have any liability for any errors, omissions, or interruptions of the S&P/TSX Index.
Bloomberg Finance L.P. Used with permission of Bloomberg Finance L.P.
Concerned about your portfolio?
Subscribe to Letko Brosseau’s newsletter and other publications: