 Canada - FR
 U.S. - EN
2025-26 Highlights
January 2026
The global economy proved more resilient than many had anticipated over the past year. Entering 2025, consensus expectations for growth were tempered by lingering recession concerns, tariff-related uncertainty, and ongoing geopolitical tensions. Instead, real global economic activity advanced at a moderate rate. Inflation across developed markets declined toward central bank targets, and the monetary policy easing that began in 2024 continued through 2025, with central banks executing measured rate cuts.
Global equity markets reached all-time highs, and major indices closed out a third consecutive year of double-digit gains. The market’s rise was briefly interrupted in late January by a sell-off across selected technology and power generation stocks, following the release of a low-cost open-source model by the Chinese AI startup DeepSeek. Nvidia alone lost nearly $600 billion in market capitalization, marking the largest one-day decline in U.S. equity market history. Then in April, President Trump’s “Liberation Day” tariff announcement triggered a sharp decline in broad market indices. These dislocations, however, did not derail overall market momentum, and most asset classes finished the year with strong positive returns.
Market gains extended beyond large U.S. technology companies, encompassing various regions and assets classes. The rally was particularly pronounced in emerging markets, international equities, and gold. This broader participation represented a notable shift after a decade in which U.S. equities outperformed.
Looking ahead, we remain cautiously optimistic. While near-term volatility may persist, we believe our portfolios are positioned to deliver value over the medium-to-long-term. As we pause and reflect on the highlights of the prior year, we also take this opportunity to share with you our expectations for 2026.
A look back on 2025
Global economic growth in 2025 surpassed consensus expectations. The year began with subdued growth forecasts amid concerns about a potential slowdown and ongoing tariff policy uncertainty, yet economic activity proved more resilient. The IMF revised its estimate for global real GDP growth upward to 3.2%, broadly in line with the prior year.
Inflation across the developed world continued to recede towards 2%, and, as a result, central banks cut rates throughout the year (Chart 1).
Central Bank Policy Rates
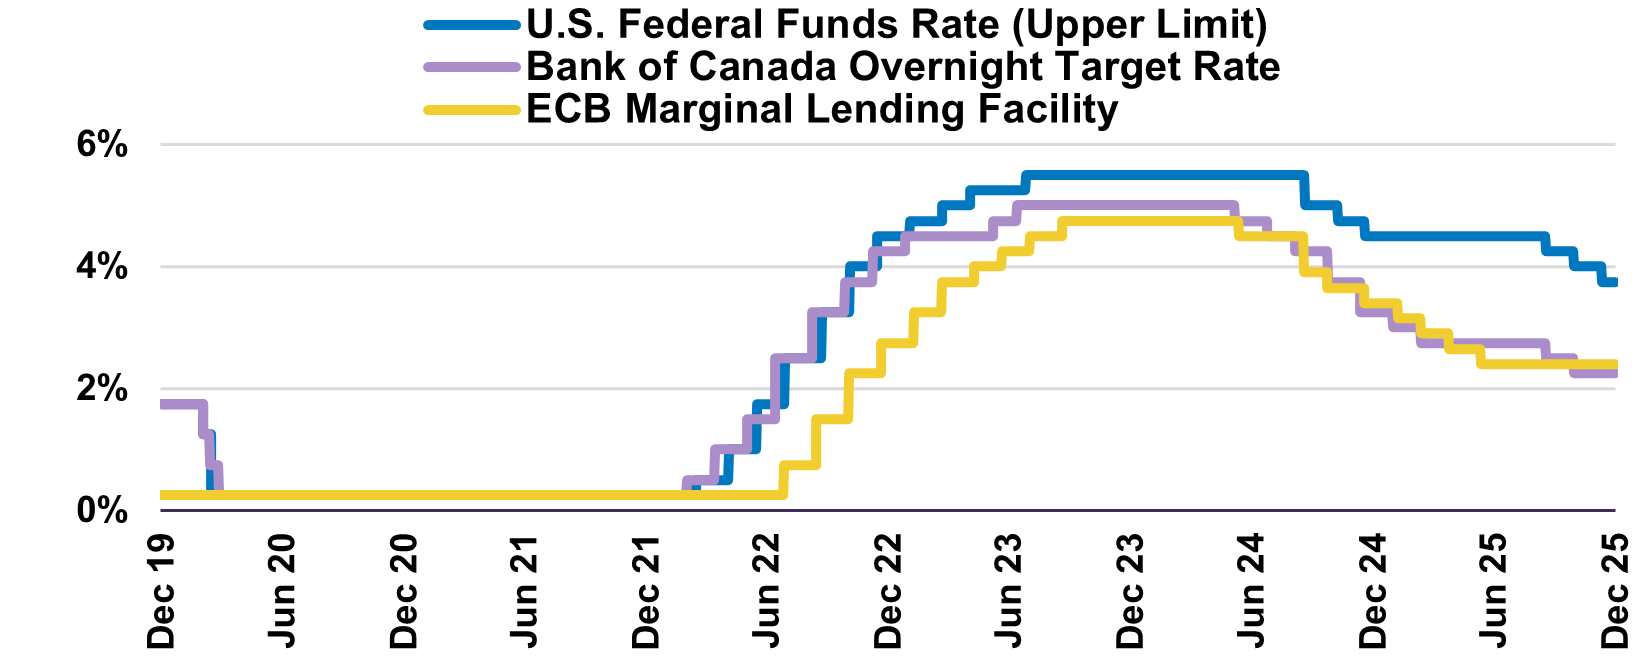
The main risk facing the global economy was the onset of a trade war. Canada has weathered the headwinds from higher tariffs better than anticipated. While certain sectors, including steel and aluminum, automotive, and lumber, were subject to high tariffs, exemptions under the Canada–United States–Mexico Agreement (CUSMA) kept effective rates below 5%, far lower than the initially announced 35%. Public capital expenditures are expected to increase from 1% to 2% of GDP, and with Canada’s net debt currently at 8.3% of GDP, the lowest in the G7, there is room for additional fiscal support if required (Table 1).
G7 Government Finances
Percent of GDP, 2025
| Country | Deficit as a % of GDP | Net Debt* |
| Canada | 2.0% | 8.3% |
| Germany | 2.7% | 27.8% |
| United Kingdom | 5.3% | 76.0% |
| France | 5.4% | 78.5% |
| Japan | 1.6% | 87.9% |
| United States | 6.2% | 98.1% |
| Italy | 3.1% | 123.4% |
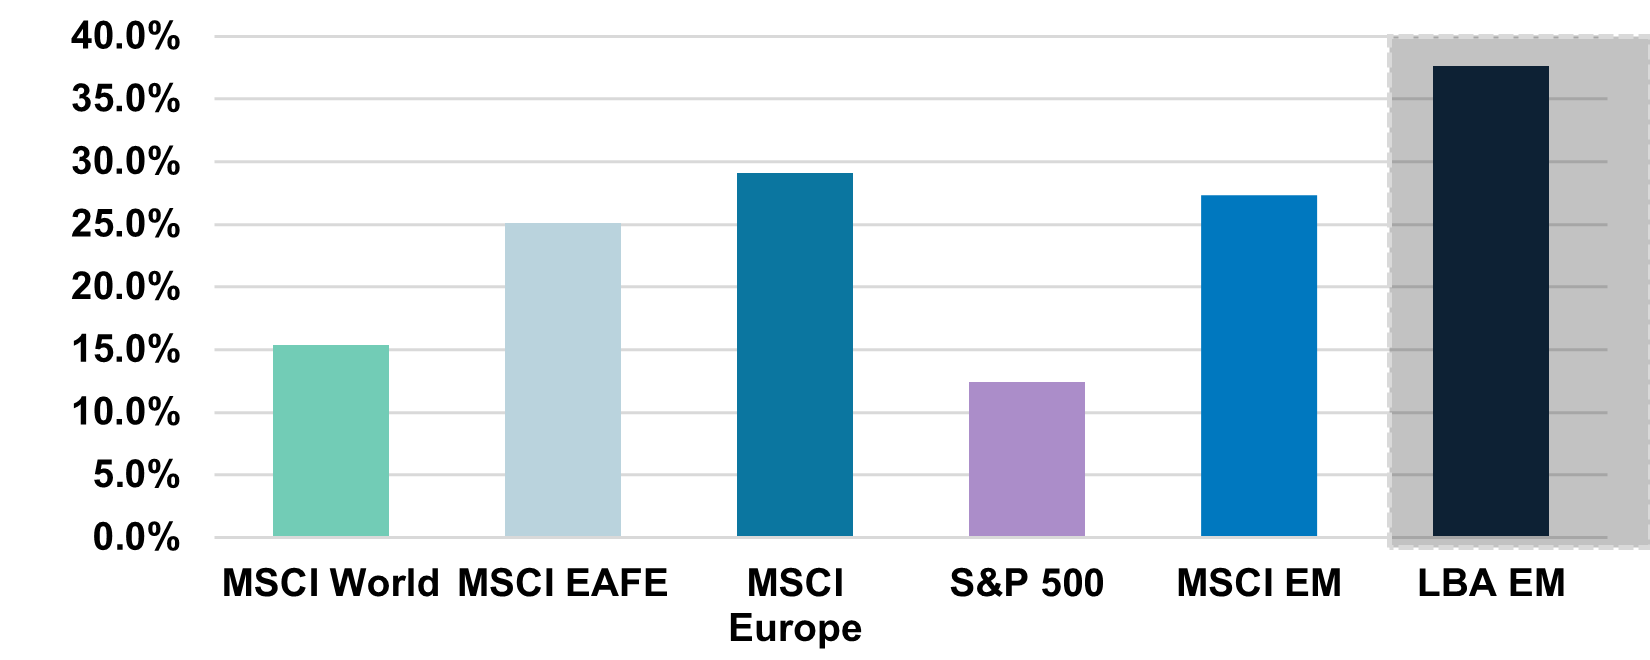
Equity markets also outperformed expectations, driven by steady consumer demand, broadly accommodative policy and resilient corporate earnings. The S&P 500 delivered 12.4% return (total return in Canadian dollars), while the S&P/TSX gained 31.7%, MSCI EAFE 25.1%, MSCI ACWI 16.6%, and MSCI Emerging Markets 27.3%.
Beyond developed market equities, two asset classes stood out in 2025: gold and emerging markets. As highlighted in our November Portfolio Update, gold prices reached record levels, supported by sustained central bank purchases and increased demand from investors seeking havens that serve as an alternative to U.S. treasuries amid elevated economic and geopolitical uncertainty.
Emerging markets also delivered strong returns over the past year (Chart 2). Importantly, this performance was achieved alongside attractive valuations. The MSCI EM index trades at a forward price-to-earnings multiple of 13.2x, well below the S&P 500 Index multiple of 22.0x, further reinforcing the case for diversification beyond U.S. markets. Our global equity and balanced portfolios have been well-positioned to capture this growth. Emerging markets represents roughly 20% of the equity allocation and accounted for approximately one-quarter of total net gains for these portfolios in 2025. The LetkoBrosseau Emerging Markets Equity strategy currently trades at a compelling 10.8x forward 2026 earnings and offers a 4.1% dividend yield.
Equity Indices 2025 Performance: Total Return
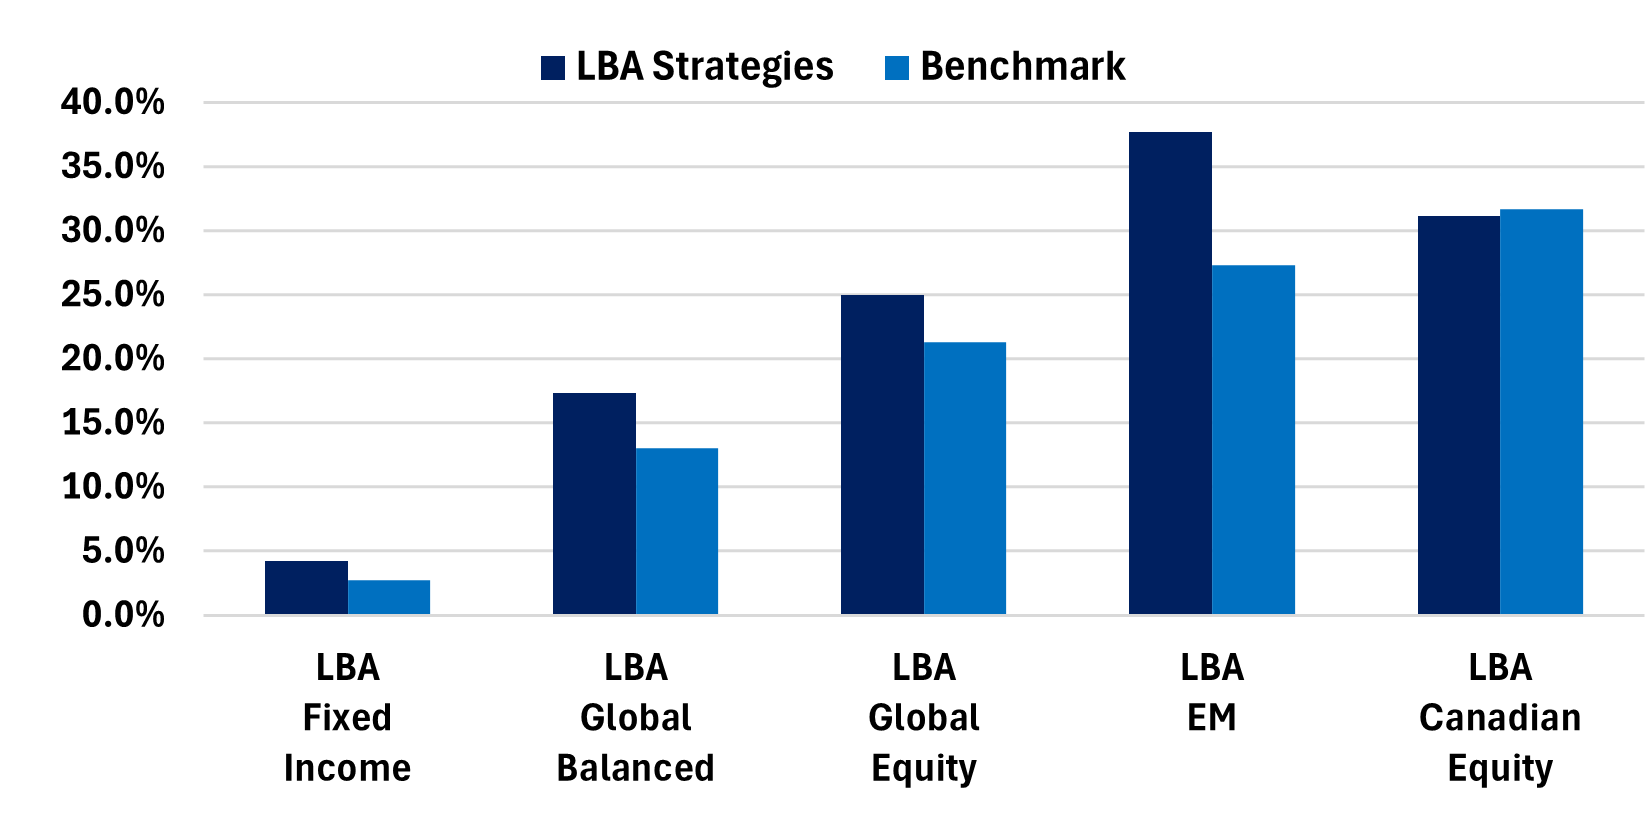
Overall, our investment strategies performed well during the past year (Chart 3). Regarding portfolio activity, sales modestly exceeded purchases as several holdings reached or surpassed our fair estimate of intrinsic value, prompting us to trim or exit positions. This approach resulted in a moderate cash position across our portfolios. Currently, balanced mandates remain near target equity allocations.
LetkoBrosseau Investment Strategies
2025 Performance: Total Return
Fixed income markets adjusted to another consecutive year of rate cuts, with the short end of the yield curve dropping around 35 basis points by end-December. In contrast, Canadian 10-year and 30-year government bond yields closed the year at 3.4% and 3.9% respectively, about 19 and 59 basis points respectively above their 2024 year-end levels.
In the last couple of years, we lengthened the duration of our portfolios and increased our holdings in high-quality corporate bonds. These adjustments supported our fixed income portfolio in generating a solid return of 4.2% compared with the benchmark’s 2.7% over the calendar year period. Our overarching strategy remains unchanged; we are maintaining a lower duration than the index and continue to avoid bonds with a term above ten years. Currently, the average duration of our portfolios is around 3.8 years, notably below the benchmark’s duration of 6.9 years. In our view, longer-dated Canadian bonds are still expensive. We estimate current the fair value of the 10-year Canadian government bond yield to be around 4.0%, compared to its current yield of 3.4%.
2025 Highlights at LetkoBrosseau
LetkoBrosseau remained dedicated to communicating our investment strategy to clients in a clear, timely, and transparent manner via our flagship monthly Portfolio Update letters and quarterly Economic and Capital Markets Outlook reports.
Building on this communication framework, we introduced quarterly Research Insights webinars, featuring members of our investment team who shared perspectives on portfolio positioning, economic developments, and capital markets. We were also particularly pleased to host in-person Client Appreciation events in Montreal, Toronto, and Calgary, providing a valuable opportunity to meet with clients directly, exchange perspectives, and strengthen relationships. We greatly appreciated the time our clients dedicated to joining these events and the thoughtful conversations that followed.
Our commitment to in-house fundamental research remained central to our investment process. Throughout 2025, our research team conducted over 700 meetings with company management teams and industry experts globally. This level of engagement reflects the ongoing rigor of our research discipline and serves as an important risk-management tool in security selection and portfolio construction.
Since partnering in 2023 with Navigator, an independent market research and public affairs firm, we have conducted annual surveys. Feedback from these surveys has been instrumental in guiding our initiatives and improving our services. In 2025, client input directly informed the launch of our Research Insights webinars and supported enhancements to our secure online client portal.
Regarding our business initiatives, we continue to advance the launch of mutual fund vehicles for our core investment strategies, which we expect to finalize in the first quarter of 2026. These funds will provide clients with greater flexibility and accessibility. Additionally, ChapmanCraig, a multi-family office based in Hong Kong, successfully launched an Open-ended Fund Company (“OFC”) vehicle in the fall of 2025, for which we act as investment manager of a global equity strategy. This investment vehicle caters to Asia-based clients.
Moreover, we continue to strengthen our international presence through our Emerging Markets Equity strategy. In the U.S., this strategy remains supported through our partnership with Arrow Partners, a New York-based third-party marketing firm. In Europe, we act as investment manager for a UCITS fund offered by Candoris, a Netherlands-based firm, providing global investors outside of the U.S. and Canada with access to our Emerging Markets strategy. For U.S.-based institutional clients, our 3c7 commingled fund remains available.
In terms of firm developments, we reached a significant milestone in 2025 by expanding our talent base to more than 100 employees across our offices in Montreal, Toronto, and Calgary. This milestone reflects the strength and depth of our team as well as our ongoing commitment to delivering exceptional research, portfolio management, and client service.

We were also pleased to announce the appointment of David Després as Executive Vice-President. Mr. Després has over 24 years at LetkoBrosseau, including extensive experience in investment management and leading the business development and client servicing teams. In his expanded role, he also oversees the operations, information technology, and project management teams. His leadership will be key in continuing to serve our clients and advancing the firm’s long-term goals.
On the governance front, we welcomed two additional independent board members, bringing our total Board of Directors to eight. Ms. Colleen Johnston and Mr. Roger Renaud joined the Board of Directors effective March 3, 2025.

Ms. Colleen Johnston, former Chief Financial Officer of Toronto-Dominion Bank, brings 14 years of experience at TD, including 10 as Group Head and CFO, and 15 years at Scotiabank. She has been recognized for her leadership, including being named Canada’s CFO of the Year in 2012 and inducted into Canada’s Most Powerful Women: Top 100 Hall of Fame in 2007. Ms. Johnston is a Fellow Chartered Accountant with broad board and community involvement.

Mr. Roger Renaud has over 12 years of experience as president of investment firms, including serving as President for Canada and Global COO of Manulife Asset Management. He also served as President of Standard Life Investments from 2006 to 2015. Mr. Roger holds a Bachelor’s degree in actuarial science and is a CFA® charterholder with extensive board and non-profit experience.
Both Ms. Johnston and Mr. Renaud are well-respected in Canada’s financial community and bring valuable strategic insight. Their guidance will be instrumental as LetkoBrosseau continues to grow and serve its clients.
A look forward to 2026
As we enter 2026, our base case forecast is for another year of positive, albeit moderate, growth. We anticipate global real GDP will rise 3.1% in 2026, slightly lower than the IMF’s 3.2% forecast for 2025.
Moreover, we forecast U.S. real GDP growth to moderate between 1.0-2.0% in 2026, while Canadian real GDP is also expected to grow in the 1.0-2.0% range. Elsewhere, emerging markets are expected to advance by 4.0% in 2026, according to the IMF. As highlighted in our latest Economic and Capital Markets Outlook, a key risk in our view lies not in economic fundamentals, which remain broadly supportive, but rather in elevated equity valuations and ambitious earnings expectations within certain segments of the market. In this environment, we believe the most prudent approach is disciplined stock selection and patience in the redeployment of capital.
Our equity portfolio remains well-diversified across companies, sector, and regions. It is further underpinned by structural growth drivers, including technological innovation, demographic shifts and evolving economic trends. With holdings trading at attractive valuations, we are confident our portfolios should provide value creation over the next 3-5-year horizon.
On the client services front, we are continuously enhancing our secure client portal to provide greater convenience and accessibility. We encourage clients to transition to digital statements to reduce paper waste and invite those who have not yet activated access to contact their account representative.
Additionally, we look forward to continuing to host in-person client events and our series of quarterly Research Insights webinars throughout 2026.
Since 1988, our investment process has delivered compound annualized returns of 11.7% for all assets under management, compared with 8.9% for the benchmark, and equity returns of 13.7%, outperforming the benchmark of 8.9%1. Over that time, more than $42.4 billion in cumulative gains have been generated for our clients2.
We closed the year with $20.6 billion in assets under management, an increase of over $3 billion from $17.5 billion in 2024.
We are proud and honoured to provide our investment services to a multitude of pension plans, foundations and endowments, family offices, corporations, and high net worth individuals located around the world. We are confident that our investment approach, which emphasizes companies chosen for their strong business franchises, experienced top management, attractive growth prospects and reasonable valuations, will continue to generate value over the long term.
We thank you for entrusting us with the responsibility of investing on your behalf.
All of us at LetkoBrosseau wish you and your families joy, good health and prosperity in the new year

Daniel Brosseau
PRESIDENT

Peter Letko
SENIOR ADVISOR

David Després
EXECUTIVE VICE-PRESIDENT

Stéphane Lebrun
VICE PRESIDENT –
INVESTMENT MANAGEMENT

Rohit Khuller
VICE PRESIDENT –
INVESTMENT MANAGEMENT

Isabelle Godin
VICE PRESIDENT – OPERATIONS AND CFO
2. Represents the net gains on all assets for all mandates under management from January 1, 1988 to December 31, 2025.
__
All dollar references in the text are U.S. dollars unless otherwise indicated.
The information and opinions expressed herein are provided for informational purposes only, are subject to change and are not intended to provide, and should not be relied upon for, accounting, legal or tax advice or investment recommendations. Any companies mentioned herein are for illustrative purposes only and are not considered to be a recommendation to buy or sell. It should not be assumed that an investment in these companies was or would be profitable. Unless otherwise indicated, information included herein is presented as of the dates indicated. While the information presented herein is believed to be accurate at the time it is prepared, Letko, Brosseau & Associates Inc. cannot give any assurance that it is accurate, complete and current at all times.
Where the information contained in this presentation has been obtained or derived from third-party sources, the information is from sources believed to be reliable, but the firm has not independently verified such information. No representation or warranty is provided in relation to the accuracy, correctness, completeness or reliability of such information. Any opinions or estimates contained herein constitute our judgment as of this date and are subject to change without notice.
Past performance is not a guarantee of future returns. All investments pose the risk of loss and there is no guarantee that any of the benefits expressed herein will be achieved or realized.
The information provided herein does not constitute investment advice and it should not be relied on as such. It should not be considered a solicitation to buy or an offer to sell a security. It does not take into account any investor’s particular investment objectives, strategies, tax status or investment horizon. There is no representation or warranty as to the current accuracy of, nor liability for, decisions based on such information.
Certain information contained in this document constitutes “forward-looking statements,” which can be identified by the use of forward-looking terminology such as “may,” “will,” “should,” “expect,” “anticipate,” “target,” “project,” “estimate,” “intend,” “continue” or “believe,” or the negatives thereof or other variations thereon or comparable terminology. Forward-looking statements are inherently subject to, among other things, risks, uncertainties and assumptions regarding currencies, economic growth, current and expected conditions, and other factors that are believed to be appropriate in the circumstances which could cause actual events, results, performance or prospects to differ materially from those expressed in, or implied by, these forward-looking statements. Readers are cautioned not to place undue reliance on these forward-looking statements.
The MSCI information may only be used for your internal use, may not be reproduced or redisseminated in any form and may not be used as a basis for or a component of any financial instruments or products or indices. None of the MSCI information is intended to constitute investment advice or a recommendation to make (or refrain from making) any kind of investment decision and may not be relied on as such. Historical data and analysis should not be taken as an indication or guarantee of any future performance analysis, forecast or prediction. The MSCI information is provided on an “as is” basis and the user of this information assumes the entire risk of any use made of this information. MSCI, each of its affiliates and each other person involved in or related to compiling, computing or creating any MSCI information (collectively, the “MSCI parties”) expressly disclaims all warranties (including, without limitation, any warranties of originality, accuracy, completeness, timeliness, non-infringement, merchantability and fitness for a particular purpose) with respect to this information. Without limiting any of the foregoing, in no event shall any MSCI Party have any liability for any direct, indirect, special, incidental, punitive, consequential (including, without limitation, lost profits) or any other damages. (www.msci.com).
The S&P/TSX Index is a product of S&P Dow Jones Indices LLC or its affiliates (“SPDJI”) and TSX Inc., and has been licensed for use by Letko, Brosseau & Associates Inc. Standard & Poor’s® and S&P® are registered trademarks of Standard & Poor’s Financial Services LLC (“S&P”); Dow Jones® is a registered trademark of Dow Jones Trademark Holdings LLC (“Dow Jones”); and these trademarks have been licensed for use by SPDJI and sublicensed for certain purposes by Letko, Brosseau & Associates Inc. TSX® is a registered trademark of TSX Inc., and have been licensed for use by SPDJI and Letko, Brosseau & Associates Inc. Letko, Brosseau & Associates Inc.’s product is not sponsored, endorsed, sold or promoted by SPDJI, Dow Jones, S&P, their respective affiliates, or Bloomberg and none of such parties make any representation regarding the advisability of investing in such product(s) nor do they have any liability for any errors, omissions, or interruptions of the S&P/TSX Index.
BLOOMBERG®” and the Bloomberg indices listed herein (the “Indices”) are service marks of Bloomberg Finance L.P. and its affiliates, including Bloomberg Index Services Limited (“BISL”), the administrator of the Indices (collectively, “Bloomberg”) and have been licensed for use for certain purposes by the distributor hereof (the “Licensee”). Bloomberg is not affiliated with Licensee, and Bloomberg does not approve, endorse, review, or recommend the financial products named herein (the “Products”). Bloomberg does not guarantee the timeliness, accuracy, or completeness of any data or information relating to the Products.
CFA: A professional certificate offered through the CFA Institute. The certification qualifies one to be a financial analyst. To qualify for a CFA®, one must have worked a certain number of years in the financial industry and must complete three levels of exams on all topics related to investing. CFA® charterholders are required to adhere and annually attest to the CFA Institute Code of Ethics and Standards of Professional Conduct.
The benchmark for the LetkoBrosseau Fixed Income composite consists of 5% FTSE Canada 91 Day T-Bill Total Return Index and 95% FTSE Canada Universe Bond Total Return Index.
The benchmark for the LetkoBrosseau Global Balanced composite consists of 5% FTSE Canada 91 Day T-Bill Total Return Index, 40% FTSE Canada Universe Bond Total Return Index, 20% S&P/TSX Composite Total Return Capped Index, and 35% MSCI All Country World Total Return Net Index.
The benchmark for the LetkoBrosseau Global Equity (Canadian bias) composite consists of 2% FTSE Canada 91 Day T-Bill Total Return Index, 34% S&P/TSX Composite Total Return Capped Index and 64% MSCI All Country World Total Return Net Index.
The benchmark for the LetkoBrosseau Emerging Markets Equity composite is 100% MSCI Emerging Markets Total Return Net Index.
The benchmark for the LetkoBrosseau Canadian Equity composite consists of 2% FTSE Canada 91 Day T-Bill Total Return Index and 98% S&P/TSX Composite Total Return Capped Index.
Concerned about your portfolio?
Subscribe to Letko Brosseau’s newsletter and other publications: