 Canada - FR
 U.S. - EN
- We anticipate another year of positive but subdued growth for the global economy. We forecast global real GDP to advance by 3.1% in 2026, compared with 3.0% in 2025.
- Weaker labour market trends are expected to temper U.S. economic activity in the year ahead. Our outlook is for U.S. real GDP to moderate to 1.0-2.0% in 2026.
- The Canadian economy is set to benefit from lower interest rates and stimulative fiscal policy. We forecast Canadian real GDP growth to accelerate to between 1.0-2.0% in 2026.
- Activity in the Eurozone remains soft, but a supportive policy mix will help growth improve next year. We anticipate Eurozone real GDP growth of about 1.0% in 2026.
- The Chinese economy has weathered the shock of tariffs better than expected. Nevertheless, activity is cooling. According to the IMF, real GDP is projected to expand by 4.2% in 2026.
- Prospects vary by country but, in aggregate terms, the IMF forecasts emerging markets’ real GDP growth will remain broadly stable at 4.0% next year.
- Equity market valuations are lofty and earnings growth estimates remain elevated. Given our base case forecast for below-trend global growth, we remain mindful of the disconnect between fundamentals and investor expectations.
- In this environment, we maintain that the best-suited strategy is an active approach that emphasizes price sensitivity, careful stock selection and a moderate cash reserve. We do not advocate for any material shifts in asset allocation at this juncture.
Summary
Trade-related distortions are fading and recent readings of economic data suggest the global economy remains broadly resilient. While we are attentive to emerging job market weakness and acknowledge a still-elevated level of tariff uncertainty, we do not expect a deterioration in global economic activity next year.
Monetary policy is loosening globally as central banks are cutting interest rates, and many governments are either maintaining or expanding fiscal deficits. After being buffeted by a sharp rise in trade barriers in 2025, the world economy is positioned to benefit from supportive policies that were introduced during this tumultuous year. We forecast global real GDP will advance 3.1% in 2026, a level similar to 2025, as government stimulus measures emerge as offsets to weaker trade and employment trends.
Although the projected level of economic activity is broadly stable, we believe a notable disconnect between fundamentals and investor expectations persists. U.S. equity market valuations have returned to lofty levels, and earnings growth estimates are elevated. This backdrop implies that negative changes in sentiment present the biggest risk to the economy and financial markets. We remain of the view that the best-suited strategy for the current environment is an active approach that emphasizes price sensitivity, careful stock selection and a moderate cash reserve.
U.S. positioned for mild deceleration
U.S. real GDP expanded by 0.9% quarter-on-quarter in Q2, a sharp contrast to the 0.2% contraction over the first three months of the year. This sequential improvement partly reflected an unwinding of the Q1 surge in imports, which subtracted from GDP growth in the first quarter. Imports fell 8.3% quarter-on-quarter in Q2 as U.S. households and companies pared back foreign purchases. Meanwhile, final domestic demand (GDP less trade and inventories) recorded a healthy 0.6% increase. In real annual terms, the economy grew by 2.1% in the same period.
While the U.S. economy has so far remained relatively steady, activity is likely to moderate through the remainder of the year. In August, the jobs market added only 22,000 positions and hiring figures were revised lower for the prior two months. Taken together, the 88,000 job gains recorded from June to August indicate a marked deceleration from the 297,000 added in the previous three months.
Notable downward revisions to hiring data reinforce our view that labour demand is waning, yet the jobs market has cooled without a material uptick in unemployment. Indeed, the unemployment rate has been broadly stable over the past year and remains historically low at just 4.3% in August.
An absence of large-scale layoffs, real wage growth and positive net worth effects present additional support to the outlook for consumption. On the wage front, average hourly earnings rose 3.7% year-on-year in August, tracking ahead of inflation (2.9%). With household net worth rising to $167 trillion at the end of Q2 and equity markets continuing to advance, we believe consumer spending will slow but remain anchored in positive territory in the coming months.
Trends in other categories of domestic demand are also consistent with a slowing economy. Business investment rose 1.8% quarter-on-quarter in Q2. However, growth was primarily attributable to spending on intellectual property (+3.6%) and equipment (+2.1%), two areas that have been strong in recent months amid the current AI investment boom. While this pattern could persist, broader investment has lost momentum. Business spending in structures (-1.9%) and residential investment (-1.3%) both contracted in the second quarter.
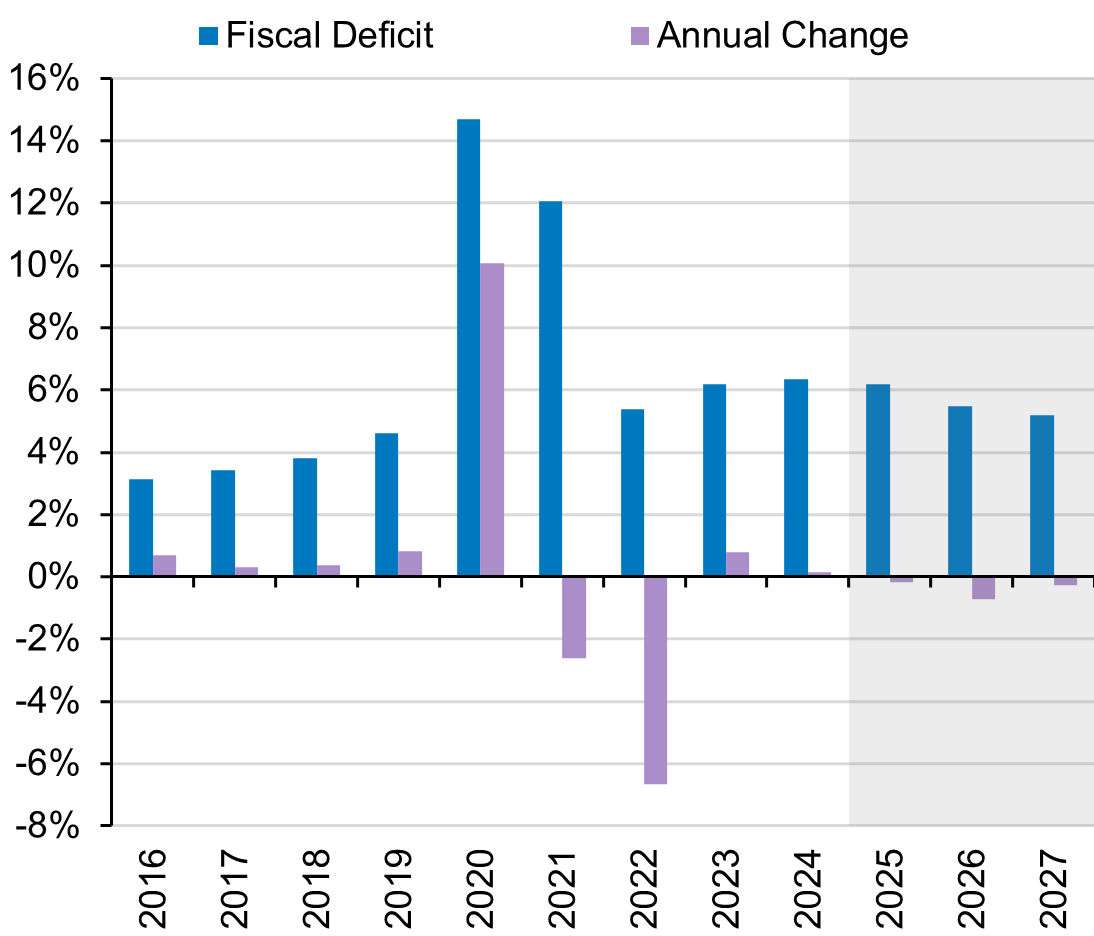
U.S. government spending growth has been slower than in previous years. Government expenditures rose 2.3% against a year ago through the first half of 2025, compared to 3.9% in the same period during 2024. While the tax and spending plans contained in the One Big Beautiful Bill Act imply larger fiscal deficits in absolute terms, as a share of GDP, deficits are projected to shrink relative to past years (Chart 1). We expect government spending to provide less of a boost to U.S. activity going forward.
Whereas the outlook for fiscal policy has become clearer as of late, monetary policy now presents the wildcard to our forecast for the U.S. economy. Benchmark interest rate cuts are likely to be gradual as the Federal Reserve continues to weigh inflation dynamics against labour market trends. However, prospective deregulatory initiatives in the financial sector could trigger a broad re-leveraging cycle and provide an economic boost in the near term despite potentially introducing longer-run risks. In our assessment, U.S. growth could be markedly higher than anticipated if bank capital requirements are relaxed.
As the U.S. economy continues to adjust to higher tariffs, our base case is for U.S. real GDP growth to moderate to between 1.0-2.0% in 2026. While looser bank regulations may provide upside to our forecast, the primary risk on the downside is the possibility that a swing in sentiment and market pullback could have a negative wealth effect, driving growth materially lower.
U.S. Fiscal Deficit (Percent of GDP)
Canadian outlook underpinned by fiscal expansion
Tariffs emerged as a restraint on Canadian activity in Q2. Real GDP fell 0.4% quarter-on-quarter as a substantial drop in exports (-7.5%) weighed on overall output. Exports of vehicles (-24.7%) and industrial machinery, equipment and parts (-18.5%) – products heavily reliant on U.S. demand – were especially hard hit. Despite the considerable scale of trade distortions, second quarter data also underscored a resilient domestic economy. Excluding trade, real GDP rose 1.4% quarter-on-quarter and 2.6% against a year ago.
While the economy remained broadly stable through the first half of the year, household spending – the main driver of Canadian activity – is set to soften. The unemployment rate climbed to 7.1% in August from 6.9% a month earlier and recent data indicate important changes in underlying dynamics. In July and August, job losses were the primary cause of higher unemployment rather than labour force growth outpacing job creation, as in previous months. Although layoffs have been concentrated in part-time work and trade-reliant industries for the most part, the Canadian jobs market is losing momentum.
Meanwhile, developments have been more constructive on the external front. In August, the U.S. signed an executive order confirming that USMCA (CUSMA) compliant goods would remain exempt from tariffs and Canada attempted to de-escalate tensions by removing retaliatory tariffs on U.S. products. While both countries have kept sector-specific tariffs in place, exemptions are meaningful. Indeed, an estimated 85% of Canadian trade with the U.S. remains duty free. Barring a repeal of U.S. tariff exemptions, trade should pose less of a headwind to the Canadian economy through year end.
Encouragingly, the Bank of Canada resumed its easing cycle in September, cutting its policy rate by 25 basis points amid signs of rising labour market slack and a lower risk of tariff-induced inflation. With fixed income markets currently pricing in a further 25 basis points of policy rate cuts by December 2025, the Canadian economy is set to receive timely support from easier financial conditions.
On the fiscal front, the recently unveiled “Buy Canada” plan suggests government spending will take the lead in addressing current challenges. The package features over C$5 billion for industrial initiatives, financial aid, employment insurance and social programs to bolster the Canadian economy. The clear trend of increasing government spending from a low base implies a significant fiscal push going forward. Looking ahead, there is ample space for Canada to boost government support (Table 1).
Lower interest rates and a definitive pivot to stimulative fiscal policy underpin Canada’s constructive outlook. Our base case calls for activity to pick up in the year ahead. We forecast Canadian real GDP growth to accelerate to between 1.0-2.0% in 2026, up from 0.5-1.5% in 2025.
G7 Government Finances Percent of GDP, 2025
| Budget Deficit | Net Debt | |
| Canada | 1.9% | 8.3% |
| Germany | 2.7% | 27.8% |
| U.K. | 5.3% | 76.0% |
| France | 5.4% | 78.5% |
| Japan | 1.6% | 87.9% |
| U.S. | 6.2%* | 98.1% |
| Italy | 3.1% | 123.4% |
Eurozone activity could pick up on stimulus
In the Eurozone, real GDP advanced 0.1% quarter-on-quarter in Q2. This marked a setback from growth of 0.6% in the first quarter when exports received a temporary boost from pre-tariff frontloading. On an annual basis, the Eurozone economy grew 1.5% in the second quarter. Aggregate activity has fared well relative to more pessimistic expectations. However, headline figures mask uneven regional trends.
France recorded a 0.3% quarter-on-quarter expansion in Q2, and Spain grew by an impressive 0.7%, remaining a key driver of regional growth. In contrast, output fell in Italy (-0.1%) in the same period reflecting weakness in trade-dependent sectors. Germany’s economy also shrank in the second quarter (-0.3%). As international trade disruptions compounded slumping manufacturing and investment activity in Europe’s biggest economy.
Economic malaise in Germany dates back several years. Real GDP has declined in six of the past ten quarters and a recovery by year end is unlikely in our view. However, recent policy efforts could alter the economy’s trajectory for the better, as early as 2026. With plans for €1 trillion worth of infrastructure investment over the next several years, Germany is positioned for a meaningful fiscal expansion.
German stimulus could bring beneficial spillovers to the wider Eurozone economy. Meanwhile, the U.S.-E.U. trade deal agreed in July provides much-needed certainty to businesses, potentially opening the door for a stabilization in trade flows and investment. These factors, against a backdrop of an accommodative ECB and a general increase in Eurozone defence spending, lead us to believe that Europe is poised for slightly higher growth in 2026. We anticipate Eurozone real GDP will advance by around 1.0% next year.
China is on a slowing trajectory
China maintained strong growth in the second quarter. Real GDP expanded by 5.2% year-on-year, compared with 5.4% in Q1. While China’s economy has demonstrated resilience to date, growth has relied heavily on exports and industrial production to offset domestic weaknesses. Recent economic releases indicate activity has remained robust in these supply-side areas, while demand-side data has softened.
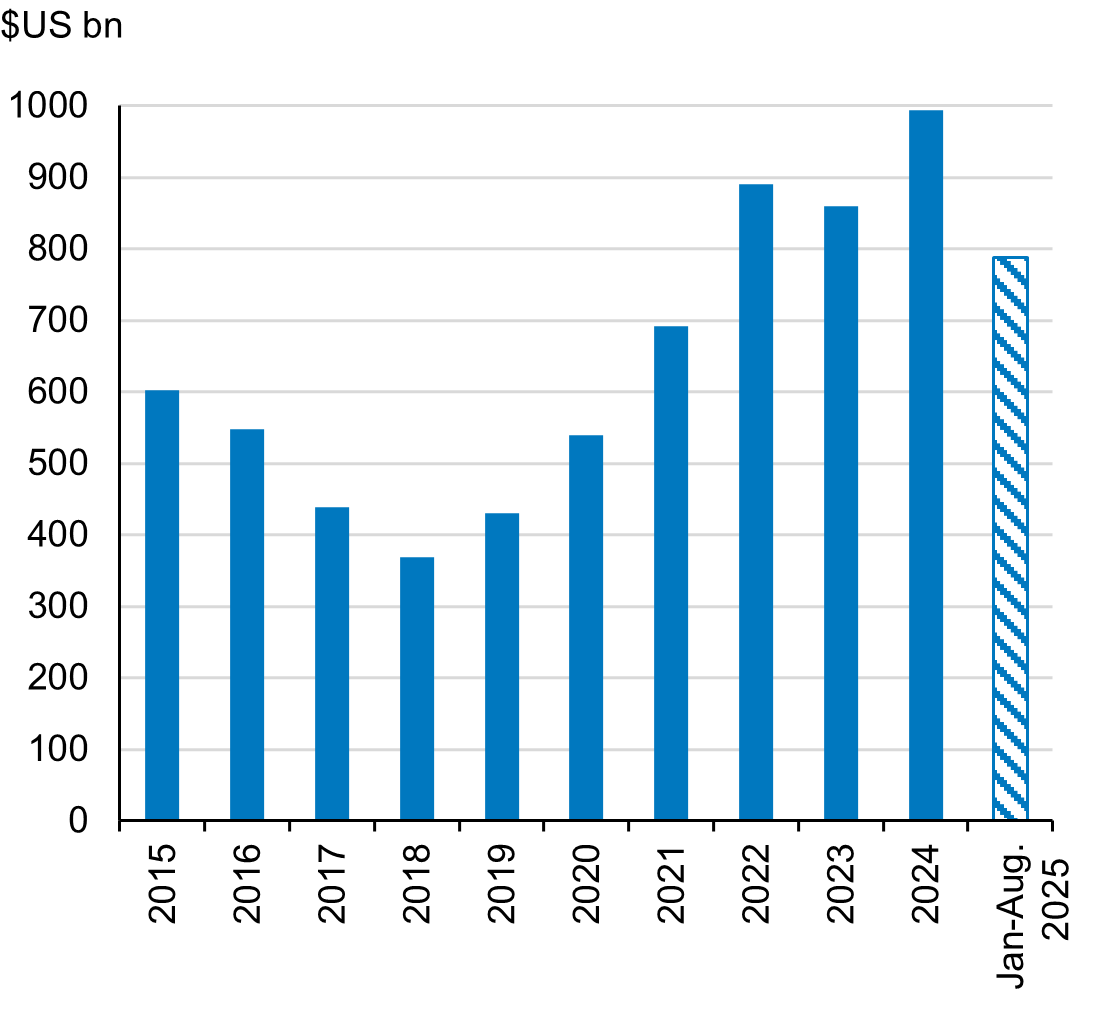
Trade between the U.S. and China has taken a substantial hit. China’s exports to the U.S. are down 15.4% against a year ago as of August. By contrast, China’s trade with the rest of the world has surged by 9.4% over the same period, helping lift total exports by 5.8%. This dynamic, coupled with muted imports, has driven better-than-expected performance in net exports. China’s trade surplus rose by $788 billion through the first seven months of the year and is well on course to match last year’s record (Chart 2).
Given strong links between China’s trade sector and industrial complex, manufacturing activity has performed well to date. Factory production advanced by a healthy 5.7% year-on-year in August. Meanwhile, manufacturing investment climbed 5.1% in the same period.
China has weathered the external shock of U.S. tariffs thus far. However, indicators of domestic demand are fueling concern that the economy is losing steam. In August, the real estate market extended a four-year slump as investment fell 12.9% year-on-year. Given its important role as a source of economic activity and household wealth, we believe China’s property sector will remain a focal point of policy efforts until clear signs of stabilization emerge. Current support measures, including mortgage interest rate cuts, relaxing of purchase restriction and social housing projects, are likely to be built upon in the months ahead.
Elsewhere, consumer spending has eased. Retail sales grew by 3.4% year-on-year in August, the slowest rate of expansion this year. Excluding the Chinese government’s RMB 300 billion ($42 billion) consumer subsidy scheme, sales growth would have been just 2.9%. Encouragingly, the trade-in program has received additional funding through year-end (RMB 138 billion). Recently announced subsidies on interest rates on consumer loans and childcare (RMB 117 billion) present additional support to the outlook for consumption.
China’s current challenges are sizeable, but action is being taken to shore up the economy. The IMF forecasts China’s real GDP will grow by 4.2% in 2026.
China's Trade Surplus
Mixed prospects for emerging markets
In India, real GDP rose 7.8% year-on-year in Q2. Household spending (+7.0%) accelerated from the previous three months as inflation slowed and boosted consumers’ purchasing power. Investment increased by a robust 7.8% in the same period amid easier financial conditions. Since then, a sharp deterioration in the trade environment has cast doubt on India’s growth prospects.
The U.S. doubled its tariff rate on India to 50% in August, over India’s purchase of discounted Russian oil. While this move brought levies on India to among the highest globally, there are mitigating factors at hand. India has a minor reliance on U.S. trade as goods exports to the U.S. represent just 2.3% of GDP. In addition, previously planned tax reforms have come into effect and Goods and Services Tax (GST) cuts could bring an immediate boost to private spending.
India’s domestically focused economy should be able to withstand a drop in U.S. trade, given strong baseline growth, tax cuts and lower interest rates. According to the IMF, India is on track for real GDP growth of 6.4% in 2026.
Growth is soft in Mexico, but activity has fared better than expected to date. Real GDP rose 0.4% year-on-year in the first half of 2025, defying forecasts that tariff-related headwinds would tip the economy into recession. As is the case with Canada, tariff exemptions for USMCA (CUSMA) compliant trade have lessened the blow of U.S. levies. Meanwhile, progress on inflation and a stronger peso have allowed the Central Bank of Mexico to cut the policy interest rate by a cumulative 150 basis points since Q1. Looser monetary policy, historically low unemployment and healthy real wage growth suggest the domestic economy is on solid footing heading into 2026. The IMF expects real GDP growth in Mexico will improve to 1.4% in 2026 from this year’s forecast of 0.2%.
Brazil slowed for a third consecutive quarter in Q2 as real GDP growth moderated to 2.2% in annual terms. Looking ahead, activity is likely to trend lower as the lagged impact of the central bank’s rate hikes of the past year set in. Significantly higher U.S. duties on Brazilian goods (50% versus 10% prior) present an additional challenge but are unlikely to derail Brazil’s outlook. Products subject to 50% tariffs account for just 1.2% of GDP given numerous exemptions, and fiscal support measures equivalent to 0.4% of GDP should help limit economic damage. Overall, Brazil is expected to expand by 2.1% in 2026, per IMF estimates.
Tariff-related headwinds have swayed, but not undermined, emerging market growth this year. Outlooks vary on a country-by-country basis, however, on balance, regional activity is essentially expected to remain stable. The IMF projects emerging market real GDP growth of 4.0% in 2026 compared to 4.1% in 2025. Aggregating these prospects with our growth expectations for advanced economies, we expect global real GDP to expand by about 3.1% in 2026 (Table 2).
Global Real GDP Growth
| 2025 | 2026 | |
| World | 3.0%* | 3.1%* |
| Advanced Economies | 1.5% | 1.6% |
| United States | 1.0-2.0%* | 1.0-2.0%* |
| Canada | 0.5-1.5%* | 1.0-2.0%* |
| Eurozone | 0.5-1.5%* | ~1.0%* |
| United Kingdom | 1.2% | 1.4% |
| Japan | 0.7% | 0.5% |
| Emerging Economies | 4.1% | 4.0% |
| China | 4.8% | 4.2% |
| India | 6.4% | 6.4% |
| Brazil | 2.3% | 2.1% |
| Mexico | 0.2% | 1.4% |
Outlook for Financial Markets
Global equity markets advanced to all-time highs in the third quarter, following a strong but volatile first half of the year. The year-to-date total return of the S&P 500 was 11.1% (in Canadian dollar terms), while the S&P/TSX (23.1%), MSCI ACWI (14.6%), and MSCI Emerging Markets (23.4%) also ended the period in positive territory. Given that equity valuations have returned to lofty levels and the balance of economic data points to subdued growth in the year ahead, it is fair to question whether this positive performance is sustainable.
The S&P 500 currently trades at 22 times 2026 estimated earnings, a sizeable premium to its long-term average of 16.1. Standard & Poor’s forecasts that operating earnings will grow 17.5% in 2026, an acceleration from 10.6% estimated for this year. Given our expectations of softer real GDP growth and still-elevated policy uncertainty, we believe current earnings estimates seem like a high bar. This disconnect between economic fundamentals and market expectations highlights a significant underlying vulnerability in equity markets.
We have repeatedly warned that some areas of the market are particularly exposed to a reversal in sentiment, regardless of the negative catalyst. At this juncture, we reiterate our view that there may be too much optimism factored into the share prices of companies at the heart of generative AI exuberance. Should earnings fall short of investors’ high expectations or forward guidance disappoint, concerns about the longevity of the AI infrastructure boom could re-emerge, as was briefly seen in late August.
While such discrepancies justify a cautious approach, we believe opportunities exist for discerning, long-term investors. We highlight our decision to increase our holdings in the Canadian telecommunications space between late Q2 and early Q3 as a recent example. At the time, investor sentiment toward these businesses and the broader Canadian economy was very pessimistic and, in our view, overdone. Compelling valuations and strong potential upside in profits provided an attractive opportunity to moderately increase our position and share price performance since then has corroborated this view.
We remain committed to the principle of price discipline as we continue to exercise patience in the redeployment of capital. With the outlook for company earnings tempered by subdued economic growth and signs of euphoria in some corners of the market, we are confident this measured approach will afford us flexibility to capitalize on market dislocations in a potentially volatile period for equities.
On balance, we believe our global equity and emerging markets equity portfolios remain well valued at 12.3 and 10.9 times 2026 earnings, despite seeing double-digit returns year-to-date. Furthermore, both strategies continue to trade at substantial discounts to their benchmarks and possess strong medium-to long-term earnings growth potential. These characteristics give us confidence to remain invested even as market dynamics suggest excesses may be present.
As for fixed income, our strategy remains unchanged. We continue to focus on capital preservation and minimize risks in our bond holdings by prioritizing credit quality and avoiding long duration securities. Overall, we do not advocate any major changes in asset allocation. We are opportunistically redeploying capital and are comfortable with a moderate level of cash at present.
The information and opinions expressed herein are provided for informational purposes only, are subject to change and are not intended to provide, and should not be relied upon for, accounting, legal or tax advice or investment recommendations. Any companies mentioned herein are for illustrative purposes only and are not considered to be a recommendation to buy or sell. It should not be assumed that an investment in these companies was or would be profitable. Unless otherwise indicated, information included herein is presented as of the dates indicated. While the information presented herein is believed to be accurate at the time it is prepared, Letko, Brosseau & Associates Inc. cannot give any assurance that it is accurate, complete and current at all times.
Where the information contained in this presentation has been obtained or derived from third-party sources, the information is from sources believed to be reliable, but the firm has not independently verified such information. No representation or warranty is provided in relation to the accuracy, correctness, completeness or reliability of such information. Any opinions or estimates contained herein constitute our judgment as of this date and are subject to change without notice.
Past performance is not a guarantee of future returns. All investments pose the risk of loss and there is no guarantee that any of the benefits expressed herein will be achieved or realized.
The information provided herein does not constitute investment advice and it should not be relied on as such. It should not be considered a solicitation to buy or an offer to sell a security. It does not take into account any investor’s particular investment objectives, strategies, tax status or investment horizon. There is no representation or warranty as to the current accuracy of, nor liability for, decisions based on such information.
Certain information contained in this document constitutes “forward-looking statements,” which can be identified by the use of forward-looking terminology such as “may,” “will,” “should,” “expect,” “anticipate,” “target,” “project,” “estimate,” “intend,” “continue” or “believe,” or the negatives thereof or other variations thereon or comparable terminology. Forward-looking statements are inherently subject to, among other things, risks, uncertainties and assumptions regarding currencies, economic growth, current and expected conditions, and other factors that are believed to be appropriate in the circumstances which could cause actual events, results, performance or prospects to differ materially from those expressed in, or implied by, these forward-looking statements. Readers are cautioned not to place undue reliance on these forward-looking statements.
The MSCI information may only be used for your internal use, may not be reproduced or redisseminated in any form and may not be used as a basis for or a component of any financial instruments or products or indices. None of the MSCI information is intended to constitute investment advice or a recommendation to make (or refrain from making) any kind of investment decision and may not be relied on as such. Historical data and analysis should not be taken as an indication or guarantee of any future performance analysis, forecast or prediction. The MSCI information is provided on an “as is” basis and the user of this information assumes the entire risk of any use made of this information. MSCI, each of its affiliates and each other person involved in or related to compiling, computing or creating any MSCI information (collectively, the “MSCI parties”) expressly disclaims all warranties (including, without limitation, any warranties of originality, accuracy, completeness, timeliness, non-infringement, merchantability and fitness for a particular purpose) with respect to this information. Without limiting any of the foregoing, in no event shall any MSCI Party have any liability for any direct, indirect, special, incidental, punitive, consequential (including, without limitation, lost profits) or any other damages. (www.msci.com).
The S&P/TSX Index is a product of S&P Dow Jones Indices LLC or its affiliates (“SPDJI”) and TSX Inc., and has been licensed for use by Letko, Brosseau & Associates Inc. Standard & Poor’s® and S&P® are registered trademarks of Standard & Poor’s Financial Services LLC (“S&P”); Dow Jones® is a registered trademark of Dow Jones Trademark Holdings LLC (“Dow Jones”); and these trademarks have been licensed for use by SPDJI and sublicensed for certain purposes by Letko, Brosseau & Associates Inc. TSX® is a registered trademark of TSX Inc., and have been licensed for use by SPDJI and Letko, Brosseau & Associates Inc. Letko, Brosseau & Associates Inc.’s product is not sponsored, endorsed, sold or promoted by SPDJI, Dow Jones, S&P, their respective affiliates, or Bloomberg and none of such parties make any representation regarding the advisability of investing in such product(s) nor do they have any liability for any errors, omissions, or interruptions of the S&P/TSX Index.
Concerned about your portfolio?
Subscribe to Letko Brosseau’s newsletter and other publications: