 Canada - FR
 U.S. - EN
Economic and Capital Markets Outlook
July 2022
- Central bank rate hikes, higher inflation, the Russia-Ukraine war and lockdowns in China raised fears of a global downturn in Q2. We believe it is too soon to conclude current events will trigger a broad-based recession.
- Global economic activity is decelerating as anticipated. We expect world real GDP growth of 2.9% in 2022 and 2.6% in 2023, a 0.5% downgrade relative to our previous forecast.
- Strong labour market fundamentals suggest the U.S. economy will prove resilient. We forecast real GDP to grow 2.0% in 2022.
- Supported by high commodity prices and low unemployment, Canada is relatively well-positioned to navigate the current environment. Our outlook for real GDP growth in 2022 is 2.3%.
- Europe remains at a higher risk of recession given its reliance on energy imports from Russia. The IMF forecasts real Eurozone economic output will increase 2.8% in 2022, but a downgrade of this forecast is probable.
- Faced with the difficult task of navigating a period of tighter global financial conditions and increased currency volatility, the IMF expects emerging market real GDP to slow from 6.8% in 2021 to 3.8% in 2022.
- Equity markets corrected sharply in Q2. Financial assets trading at elevated valuations saw the steepest declines. In this environment, careful stock selection and price sensitivity remain paramount.
- Given our baseline forecast of slower yet still positive global growth, we continue to expect our equity holdings to provide meaningful value creation over the next 3-5 years. Prospects for bond returns are mediocre. We do not advocate any major shifts in asset mix and continue to favour equities over bonds.
Summary
Rising interest rates, high inflation, the Russia-Ukraine war, and renewed lockdowns in China all present challenges to the world economy. While recent indicators of activity confirm global growth is decelerating, it is too soon to conclude current events will trigger a broad-based recession as conditions vary greatly among regions.
Activity in most segments of the economy is moderating. A slowdown in consumption, as households adjust to high inflation, is expected. Global manufacturing and trade activity are also set to soften given a deceleration in consumer demand.
However, the large stock of savings resulting from pandemic-constrained spending and robust income growth will help consumers offset higher prices. Labour market fundamentals remain strong and should continue to be a tailwind for growth in major developed countries. Meanwhile, receding supply chain disruptions, the progressive rollback of pandemic restrictions and a continued recovery in the service sector will limit the downside to growth.
Central banks around the world are implementing tighter policies in response to stubbornly high inflation, but the balance of risks differs across regions. Financial conditions are still growth-supportive in most developed economies – borrowing costs are low and credit is available – and fiscal policies are less than austere. The elements for a continued expansion into next year are in place. The picture for emerging markets is mixed, with some regions at higher risk of a sharp slowdown. On balance, the world economy is on a decelerating, but still expanding, trajectory. We are downgrading our forecast for global real GDP growth by about 0.5% to 2.9% in 2022 and 2.6% in 2023 (Chart 1).
Global Real GDP Growth (% Y/Y)
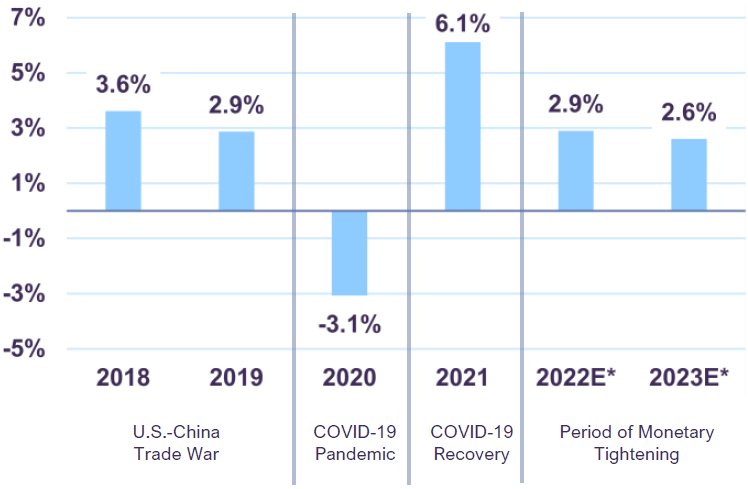
Source: IMF and Letko Brosseau
U.S. economy cooling but still on a positive trajectory
In Q1, U.S. real GDP contracted 0.4% quarter-on-quarter largely due to surging imports (+4.7%) and declining exports (-1.2%). In annual terms, real aggregate output rose 3.5% against a year ago. While trade detracted from growth in the quarter, indicators of domestic demand were strong. Nominal business investment rose 4.1% quarter-on-quarter in Q1, fueled by a 5.1% jump in purchases of machinery and equipment and a 3.1% rise in research and development spending. Meanwhile, household consumption also contributed positively to growth, up 2.2% in the same period.
The labour market has staged a near complete recovery from the 2020 recession. The outlook for job creation remains positive: employers advertised 11.4 million unfilled positions in April, near the March record-high of 11.9 million. In May, the unemployment rate dropped to 3.6% and labour force participation is just 1.1% less than its pre-pandemic level. Employment trends in the services sector are robust, with 104,000 new jobs created in May. On the wage front, average hourly earnings rose 5.2% year-on-year and, together, job gains and salary growth led to a 9.6% annual increase in aggregate weekly earnings.
Consumption of goods and services increased 9.2% year-on-year in April, and 8.5% excluding food and energy. Both measures are above inflation indicating that consumers remain a positive driver of growth despite a rise in prices. After growing at a double-digit pace during the pandemic, spending on goods moderated to a growth rate of 6.6%. In the same period, household spending on services increased 9.6% year-on-year. U.S. household expenditure on goods is now about 5% above its pre-pandemic trend, whereas service sector expenditure is still 4% below its pre-pandemic trend, reflecting a buildup of pent-up demand. Consumer spending on goods may slow going forward, but the ongoing rotation from goods to services will support service sector activity and employment into 2023.
As the U.S. Federal Reserve continues to raise interest rates to cool inflation, concern is growing that rising borrowing costs may tip the economy into recession. It should be noted that aggregate household debt service ratios for mortgage credit and consumer credit are closer to record lows than pre-pandemic averages. Therefore, while higher interest rates will represent a larger burden on households and will temper home buying activity, we do not foresee this to be a significant headwind to consumer spending over the balance of 2022.
In June, the S&P Global U.S. Composite Purchasing Managers Index (PMI) signaled a positive, but slower pace of expansion in aggregate activity. Domestic manufacturing and services sectors are remaining resilient despite higher costs and lingering supply chain issues.
The U.S. economy is slowing not contracting. As activity tempers from very strong levels, we forecast economic growth to expand by 2.0% in real terms during 2022, down from 5.7% a year prior but in-line with its long-term average.
Canada well-positioned for current challenges
In Canada, real GDP advanced 0.8% quarter-on-quarter in Q1, and 2.9% in year-on-year terms. Nominal consumer spending increased 2.4% quarter-on-quarter and investment rose 4.0%, reflecting robust domestic demand and an expansion that remains intact despite global headwinds.
The fundamentals supporting household spending are constructive. In May, the economy added a net 40,000 jobs as service sector employment continued its robust recovery. The unemployment rate declined to 5.1% in the same period, the lowest jobless rate in decades (Chart 2). Meanwhile, wage data reflects strong labour demand, as average weekly earnings rose 3.9% year-on-year.
Canadian Employment Growth
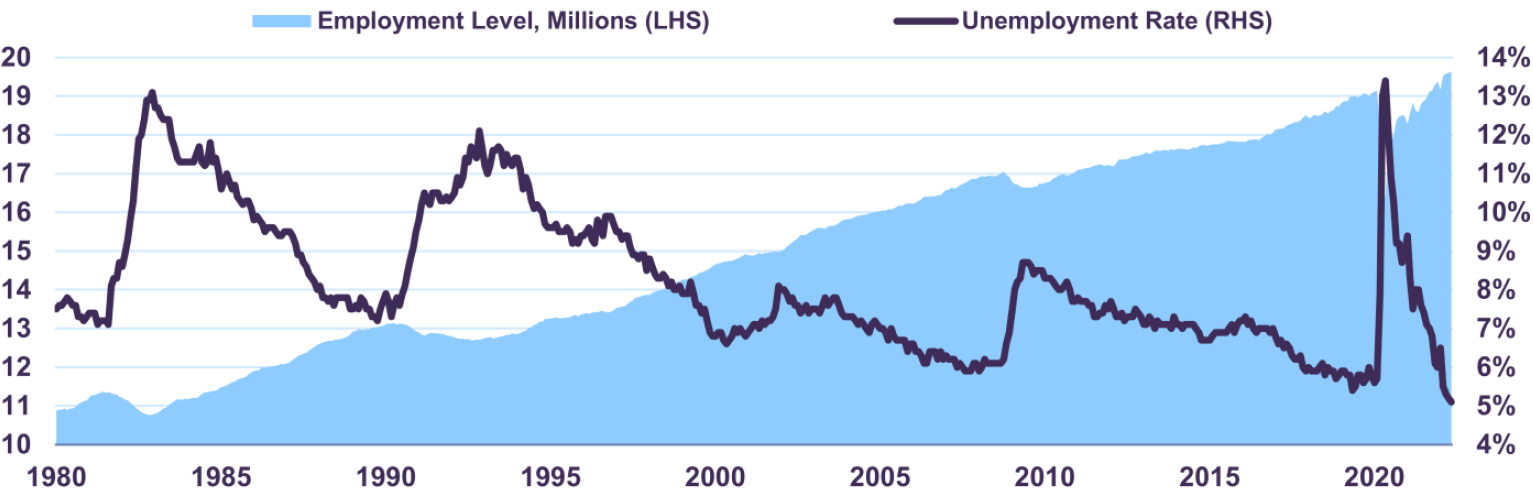
Source: Statistics Canada
With unemployment at a multi-decade low and inflationary pressures intensifying, the Bank of Canada (BoC) raised the target for its policy interest rate by 50 basis points to 1.5% in June. The BoC has signalled further rate hikes are likely. Tighter financial conditions present a headwind to activity in interest rate sensitive sectors of the economy, such as housing, and will weigh on sales of big-ticket items like furniture and appliances going forward.
However, Canada’s economy is supported by several tailwinds.The Bank of Canada estimates household savings will provide about C$40 billion (1.5% GDP) in extra purchasing power through 2023 as consumers draw down excess cash accumulated during the pandemic. Initiatives aimed at boosting housing supply as part of the federal government’s 2022 Budget Plan should also help support residential investment. Meanwhile, Canada’s position as an exporter of energy, minerals, metals and agricultural goods suggests economic growth will benefit from sizeable trade surpluses for some time.
In our assessment, Canada’s economy is relatively well-positioned to navigate the current environment. We forecast Canadian real GDP will grow by 2.3% in 2022.
Eurozone at risk of recession
Eurozone real GDP expanded by 0.6% quarter-on-quarter in Q1 as exports (+0.4%), inventory investment (+0.1%) and fixed investment (+0.1%) combined to boost growth. In the same period, household spending (-0.7%) fared less well. While labour market fundamentals are supportive – in May, unemployment fell to 6.6%, a historic low – the Russia-Ukraine war represents a key risk to the economic outlook for the Euro Area.
Europe imports 25% of its oil and 40% of its natural gas from Russia. Ongoing disruptions to energy supplies arising from the war continue to exert upward pressure on commodity prices. The European Central Bank (ECB) expects higher energy prices alone to lower Eurozone national income by 1.3% in 2022. In addition to the cost-of-living squeeze associated with higher electricity and fuel prices, food prices are up 8.7% year-on-year in May, further crimping consumer spending. Meanwhile, annual core inflation, which excludes food and energy, rose by 3.7% in June following a record 3.8% year-on year increase in May. In contrast, the average core inflation rate between 2010-2020 was 1.0%.
To combat these inflationary dynamics, the ECB signaled it will begin to raise interest rates in July from current record-low levels, marking the first rate hike in 11 years. However, financial conditions should remain constructive for some time. The main Eurozone policy interest rate is still in negative territory at -0.5%. Although net bond purchases under the ECB’s Asset Purchase Program (APP) recently ended, the bank continues to reinvest the proceeds of maturing securities. The cumulative €270 billion in liquidity added since January will lift growth into 2023. On the fiscal front, the €750 billion European Union recovery fund represents a multi-year support to activity in the region.
Intensifying inflation and dependence on Russian energy imports place the Eurozone economy at a higher risk of recession. However, a backdrop of accommodative monetary and fiscal policy points to slowing, but still positive annual growth as the base case scenario. The IMF forecasts Euro Area real GDP will expand by 2.8% in 2022, though they are likely to revise this expectation downwards in their July update.
Outlooks vary widely across EM countries
Real GDP in China grew 4.8% year-on-year in the first quarter, however a resurgence of COVID-19 plunged scores of cities back into lockdown in Q2. Economic data from April reflected the constraints imposed by China’s zero-Covid strategy: retail sales shrank 11.1% against a year ago and industrial production fell 2.9%. Since then, restrictions have loosened in dozens of cities, including key economic hubs such as Beijing and Shanghai.
Exports jumped 16.9% against a year ago in May as logistic disruptions eased and factory production improved. China’s trade surplus climbed to $78.8 billion in the same period, its highest level in four months. While external demand remains a key driver of China’s recovery, authorities are stepping up efforts to stimulate the domestic economy.
Fixed asset investment rose 6.2% year-on-year in the first five months of 2022, led by robust public sector spending (+8.5%). In May, local government special bond issuance climbed more than five times higher than a year ago and the People’s Bank of China increased the credit quota government banks use to finance infrastructure projects. The outlook for government-led infrastructure investment is promising.
Other notable stimulus measures include tax cuts and fee reductions for businesses, mortgage rate declines, and vehicle purchase tax cuts. Combined, the magnitude of fiscal and monetary policy easing during 2022 already exceeds that seen in 2021 although it will likely be more muted than the large-scale stimulus of 2020. The IMF forecasts real GDP in China will grow by 4.4% this year.
The Indian economy expanded 4.1% year-on-year in real terms during the first quarter. Rising Omicron cases and elevated commodity prices weighed on household spending, which grew only 1.8% against a year ago. In contrast, government spending (+4.8%) and investment (+5.1%) remained robust. The public health situation in India has improved considerably since Q1, and leading indicators of domestic activity point to continued growth.
In May, the S&P Global India Manufacturing PMI recorded a twelfth consecutive month of expansion, and the S&P Global India Services PMI reached its highest level in more than a decade. As the Reserve Bank of India continues to normalize monetary policy in the quarters ahead, we believe the Indian economy possesses ample momentum to sustain the current expansion into 2023. Real GDP is expected to increase 8.2% year-on-year in 2022, per IMF estimates.
Near-term growth prospects are less constructive in other major emerging economies. Brazil faces a higher risk of recession due to a protracted monetary tightening cycle, double-digit inflation, and constrained fiscal policy. In South Africa, although aggregate output returned to its pre-pandemic level in Q1, the number of unemployed persons remained 17.5% above its Q4 2019 amount. Meanwhile, the IMF anticipates a multi-year recession in Russia as a result of economic sanctions and the war with Ukraine.
Rising interest rates in developed economies present a general headwind to emerging market countries. Faced with the difficult task of navigating a period of tighter global financial conditions and increased currency volatility, the IMF expects emerging market growth to slow to 3.8% in 2022, below its long-term average of 4.5%.
Inflation still the main risk
In the U.S., headline inflation accelerated to 8.6% year-on-year in May, the highest level since 1981. Elsewhere, the pace of annual price increases quickened to a multi-decade high of 7.7% in Canada and inflation in the Eurozone set a new record at 8.6%, driven by sharp increases in energy and utility bills.
Central bankers around the world now face the challenge of raising interest rates sufficiently to curb demand and rein in inflation without weakening the job market and triggering a recession.
High headline inflation is geographically broad-based, but the sources of the most intense price pressures are concentrated in food and energy – items specifically impacted by the Russia-Ukraine war. Given the uncertainty about further sanctions and supply disruptions, we cannot exclude the possibility of another spike in commodity prices. Should energy and food inflation persist, households will likely have to pare back discretionary spending to afford these essential goods, as detailed in our April 2022 Economic and Capital Markets Outlook.
The largest contributions to core inflation are similarly concentrated in a handful of goods and services acutely distorted by the pandemic. Excluding new and used cars and trucks, car and truck rentals, airfares, lodging and furniture, U.S. core inflation would be around 2.5%. Including these items, the core inflation rate is 6.0% – an enormous impact from a group of goods and services that represent only 22% of the core CPI basket (Chart 3).
Simply put, the overall rise in prices has resulted from an imbalance between supply and demand in several key areas. Inflation initially surged due to COVID and supply chain constraints, but the Ukraine-Russia war amplified the problem. This will ultimately resolve via a combination of reducing demand through interest rate hikes, fixing the supply problems and substitution of consumer purchases. We expect that the pressure to keep raising policy rates will eventually subside and allow for global growth to find its footing.
Breakdown of U.S. Core Inflation
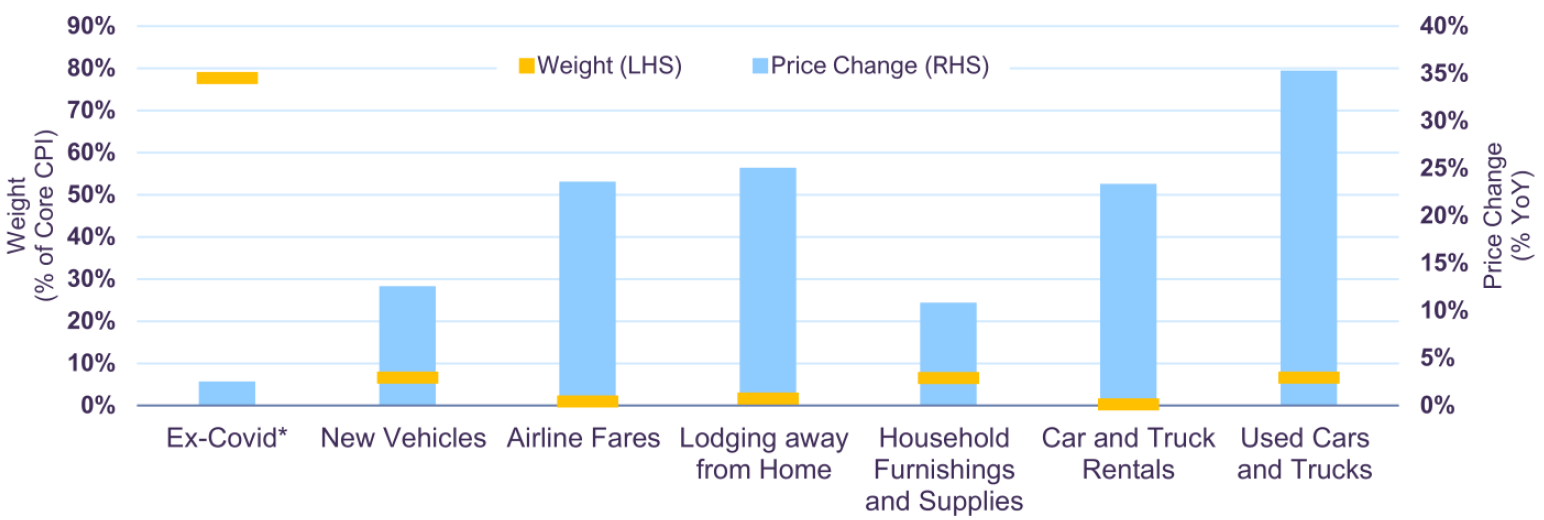
*Includes apparel, communication, education, medical care, recreation, shelter, and other goods and services
Source: Bureau of Labour Statistics
Uncertainty weighs on markets
Equity markets saw sharp corrections in the second quarter. Geopolitical uncertainty, supply shocks and rising interest rates continued to weigh on stocks, and indexes extended losses on upward revisions to inflation and downward revisions to growth. Year-to-date, the total return of the S&P 500 was -18.3% (in Canadian dollar terms), while the S&P/TSX (-9.9%), FTSE 100 (-9.7%), DAX (-24.8%), MSCI World (-18.8%) and MSCI EM (-15.9%) all contracted sharply.
Other markets, such as the NASDAQ (-27.9%) and Bitcoin (-58.8%) saw even more substantial declines. Indeed, financial assets trading at elevated valuations continue to experience the steepest corrections. For example, the top 100 most expensive stocks on a price-to-earnings basis in the S&P 500 were down 27.8% in aggregate in the first half of 2022, whereas share prices declined 11.6% for the lowest P/E quintile in the same period. Given that interest rates are on the rise, high-priced growth stocks remain vulnerable to further losses.
With monetary tightening underway, P/E expansion is unlikely and stock returns will increasingly depend on earnings going forward. Meanwhile, borrowing costs are on the rise for businesses. Our focus on firms with strong fundamentals and solid growth prospects that trade at attractive valuations is well-suited for the current environment where careful stock selection and price sensitivity are paramount. Our global equity portfolio is trading at around 10x expected 2022 earnings, a lower level than comparable benchmarks.
Long-term bonds are another expensive asset class that has seen a severe impact from rising interest rates. The year-to-date drop in U.S. and Canadian 30-year government bonds was 23.7% and 27.9% respectively, in line with the decline in the NASDAQ. Indeed, over the last 10 years, the compounded annual return derived from Canadian long-term bonds was 1.9% while the MSCI World Index, a widely-used benchmark of global equities, returned 12.1% in Canadian dollars. In dollar terms, C$100 invested in bonds at end-June 2012 would be worth C$121 today. If invested in equities, it would be worth C$313, or 2.6 times more. Inflation has averaged 2.2% over the same period. In inflation-adjusted (or 2012-dollar) terms, this works out to C$97 for long bonds and C$252 for equities.
Though bond prices have fallen significantly, the risk/return prospects of this asset class remain unattractive. At 3.23%, the yield on a 10-year Government of Canada bond is still below 4.5%, a level that is consistent with long-run estimates of 2% real GDP growth and 2.5% inflation. As the Bank of Canada is expected to raise rates by a further 200 basis points through 2023, the 10-year yield may continue to converge towards its fair value. This would spell further trouble for bonds with longer maturities. In this context, we continue to prioritize capital preservation and low duration in our fixed income holdings.
Given our baseline forecast of slower yet still positive economic growth, we expect our equity holdings to provide meaningful value creation over the next 3-5 years. We do not advocate any major shifts in asset mix and continue to favour equities over bonds.
Legal notes
All dollar references in the text are U.S. dollars unless otherwise indicated.
The information and opinions expressed herein are provided for informational purposes only, are subject to change and are not intended to provide, and should not be relied upon for, accounting, legal or tax advice or investment recommendations. Any companies mentioned herein are for illustrative purposes only and are not considered to be a recommendation to buy or sell. It should not be assumed that an investment in these companies was or would be profitable. Unless otherwise indicated, information included herein is presented as of the dates indicated. While the information presented herein is believed to be accurate at the time it is prepared, Letko, Brosseau & Associates Inc. cannot give any assurance that it is accurate, complete and current at all times.
Where the information contained in this presentation has been obtained or derived from third-party sources, the information is from sources believed to be reliable, but the firm has not independently verified such information. No representation or warranty is provided in relation to the accuracy, correctness, completeness or reliability of such information. Any opinions or estimates contained herein constitute our judgment as of this date and are subject to change without notice.
Past performance is not a guarantee of future returns. All investments pose the risk of loss and there is no guarantee that any of the benefits expressed herein will be achieved or realized.
The information provided herein does not constitute investment advice and it should not be relied on as such. It should not be considered a solicitation to buy or an offer to sell a security. It does not take into account any investor’s particular investment objectives, strategies, tax status or investment horizon. There is no representation or warranty as to the current accuracy of, nor liability for, decisions based on such information.
This presentation may contain certain forward-looking statements which reflect our current expectations or forecasts of future events concerning the economy, market changes and trends. Forward-looking statements are inherently subject to, among other things, risks, uncertainties and assumptions regarding currencies, economic growth, current and expected conditions, and other factors that are believed to be appropriate in the circumstances which could cause actual events, results, performance or prospects to differ materially from those expressed in, or implied by, these forward-looking statements. Readers are cautioned not to place undue reliance on these forward-looking statements.
The MSCI information may only be used for your internal use, may not be reproduced or redisseminated in any form and may not be used as a basis for or a component of any financial instruments or products or indices. None of the MSCI information is intended to constitute investment advice or a recommendation to make (or refrain from making) any kind of investment decision and may not be relied on as such. Historical data and analysis should not be taken as an indication or guarantee of any future performance analysis, forecast or prediction. The MSCI information is provided on an “as is” basis and the user of this information assumes the entire risk of any use made of this information. MSCI, each of its affiliates and each other person involved in or related to compiling, computing or creating any MSCI information (collectively, the “MSCI parties”) expressly disclaims all warranties (including, without limitation, any warranties of originality, accuracy, completeness, timeliness, non-infringement, merchantability and fitness for a particular purpose) with respect to this information. Without limiting any of the foregoing, in no event shall any MSCI Party have any liability for any direct, indirect, special, incidental, punitive, consequential (including, without limitation, lost profits) or any other damages. (www.msci.com).
Concerned about your portfolio?
Subscribe to Letko Brosseau’s newsletter and other publications: