 Canada - FR
 U.S. - EN
- The global economy is on track for a healthy expansion in 2023. Equities have generated strong returns year-to-date, refuting widely held views for a more pessimistic economic and market outcome.
- The risk of a more pronounced slowdown in 2024 is rising due to the lagged effects of tighter monetary policy. The IMF forecasts global real GDP to advance by 3.0% next year.
- A softer jobs market and a declining level of excess savings are expected to temper U.S. household spending. We forecast U.S. real GDP growth to moderate to 0.5-1.5% in 2024.
- Tighter financial conditions will increasingly weigh on Canada’s housing market and consumer spending. We expect real GDP growth in the range of 0.5-1.5%.
- The Eurozone economy is expanding at its slowest rate since the pandemic recession. With core inflation stubbornly high, we believe the risk of a contraction remains elevated.
- China is facing sluggish demand for its exports and a slowing domestic economy, but policymakers have pledged monetary and fiscal support. According to the IMF, Chinese real GDP growth will moderate to 4.5% in 2024.
- We are keeping a watchful eye on several keys risks to our outlook, including signs of a deterioration in China and stresses in Canada’s real estate sector. To date, we do not foresee an adverse scenario developing in either economy.
- Despite challenges to the outlook for global growth, there is an upside scenario whereby inflation moderates with minimal economic disruption. On balance, we continue to favour a well diversified and reasonably valued portfolio of equities over bonds.
Summary
Inflation is slowing and recent readings of economic data confirm the global economy is on track for a healthy expansion in 2023. Consistent with these developments, global equities have generated strong returns over the course of the year, contradicting widely held views for a more pessimistic economic and market outcome.
As noted in last year’s Economic and Capital Market’s Outlook, we did not share consensus forecasts for a recession to hit most of the developed world in 2023. However, the risk of a more pronounced slowdown is now rising, though global economic fundamentals are still generally positive. Restrictive monetary policy typically takes 12 to 18 months to be fully reflected in economic conditions. Given the steep rise in central bank policy rates since March 2022, we anticipate weaker growth for most major economies in 2024.
We are keeping a watchful eye on several key risks to our outlook, namely signs of a deterioration in China and the potential for higher interest rates to exacerbate stresses in Canada’s real estate sector. To date, we do not foresee an adverse scenario developing in either economy.
Our forecast is for global activity to remain subdued by historical standards and we ascribe a lower risk to a more pronounced recession. The IMF projects that global real GDP will expand 3.0% in 2024, below its pre-pandemic average of 3.7%[1].
U.S. adjusting to high interest rates
U.S. real GDP expanded 0.5% quarter-on-quarter in Q2, and 2.5% against a year ago. Household expenditures grew 0.4% quarter-on-quarter, reflecting strong spending on services (+0.5%) amid moderating demand for goods (+0.2%). More timely data for the third quarter appears to indicate that American consumers continue to persevere despite a challenging economic backdrop.
Retail sales increased 2.5% year-on-year in August in nominal terms, a slight deceleration from the five-month high of 2.6% recorded in July. Solid wage growth and receding inflation underpinned the continued strength of household spending. Average hourly earnings grew 4.3% year-on-year in August. In the same period, headline inflation was just 3.7%.
While wage and inflation dynamics suggest consumers should benefit from improving purchasing power in the near term, cooling demand for labour is a warning sign that the Federal Reserve’s interest rate hikes are beginning to restrain hiring activity. Over the last three months, job gains averaged 150,000 per month compared to 430,000 per month over the same period last year. Meanwhile, the number of job openings reached a multi-year low in July.
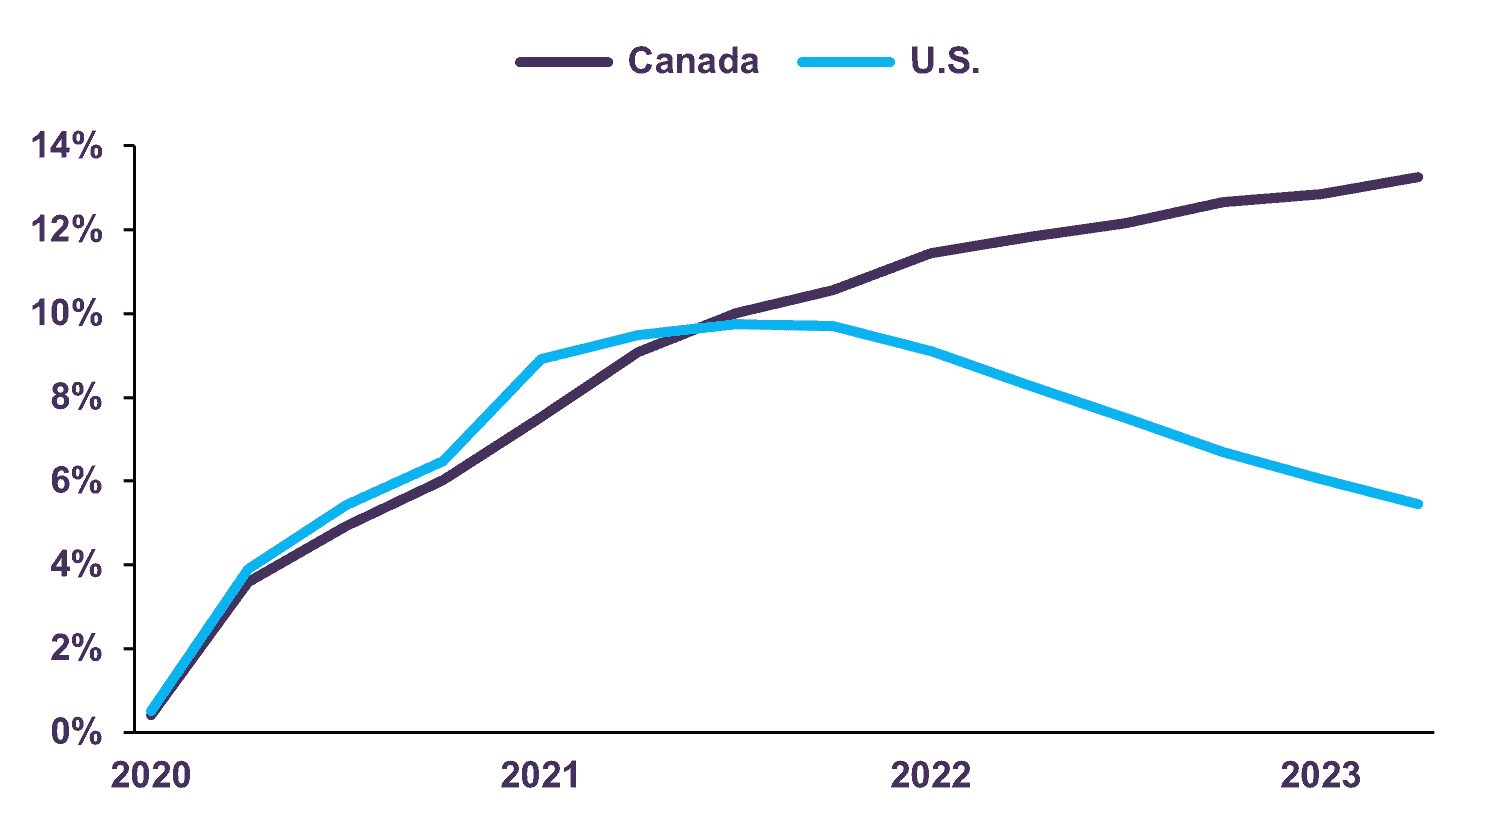
A softer jobs market, tighter lending standards and a declining level of excess savings (Chart 1) are consistent with a slowdown in consumption – the main driver of the economy – in the months ahead. Consequently, we forecast U.S. real GDP growth to moderate to 0.5-1.5% in 2024.
Pandemic Excess Savings (Percentage of 2022 GDP)
Canada resilient but slowdown ahead
Canadian real GDP stalled in Q2. While consumer spending increased by 0.1%, this was offset by a decline in housing (-2.1%), and inventory destocking as companies prepared themselves for a period of economic slowdown. Year-over-year, real GDP rose 1.1% compared to 2.1% in Q1.
Solid job creation and income gains have been key factors in the resilience of Canadian household spending to-date. However, recent trends indicate the labour market is losing momentum. The number of unemployed Canadians rose by 14,200 individuals in August and the unemployment rate remained at an 18-month high of 5.5% in the same period. Though still below pre-pandemic levels, joblessness has risen for five consecutive months, suggesting labour demand is softening in the wake of the Bank of Canada’s interest rate hikes.
Elsewhere, the effects of tighter financial conditions continue to weigh on Canada’s housing market. Existing home sales fell 4.1% from the prior month in August. Meanwhile, new home prices fell for a fifth consecutive month in the same period. Housing will continue to weigh on Canada’s near-term growth outlook.
While accumulated savings should provide a buffer for Canadian households, we expect weaker labour market conditions and restrictive monetary policy to exert more of a drag on aggregate activity going forward. Our forecast is for the Canadian economy to slow through 2024, with real GDP growing in the range of 0.5-1.5%.
Europe vulnerable to downturn
Activity in the Eurozone remained weak in Q2. Real GDP grew by a modest 0.1% quarter-on-quarter. In annual terms, real GDP is expanding at the slowest pace since the pandemic recession of 2020.
Rising interest rates and persistently high inflation have weighed more heavily in Europe than elsewhere, though some regional economies are faring better than others. France and Spain were the biggest drivers of growth in Q2, recording quarterly real GDP expansions of 0.5% and 0.4% respectively. In contrast, Germany, Europe’s largest economy, recorded zero growth, and Italy recorded a mild contraction of 0.4% quarter-on-quarter.
The ongoing slowdown in regional activity has not coincided with an increase in joblessness. Instead, the Eurozone’s unemployment rate has remained stable around a record low of 6.4% since April. The continued strength of the jobs market is likely to maintain upward pressure on wages, adding to the risk of a wage-price spiral.
Despite having raised borrowing costs by 450 bps since last July, the ECB has yet to achieve sustained disinflation. With core inflation still more than double the ECB’s 2% target, we believe the risk of recession in the Eurozone remains elevated.
China’s economy is decelerating while outlooks vary across the rest of Emerging Markets
In Q2, China’s real GDP advanced 6.3% year-on-year compared to 4.5% in the first quarter. While growth accelerated in annual terms, the data was distorted by a low base of comparison from a period when Shanghai and other major cities were locked down last year. More recent economic readings indicate that growth is slowing.
After strong growth of 7.3% in the first half of 2023, retail sales of goods expanded by 2.4% year-on-year through July and August, signalling a waning demand for goods. The outlook on services spending, however, is more encouraging. Consumer expenditures on services rose 12.4% year-on-year in August as the sector continues to benefit from pent-up demand.
Meanwhile, slowing global demand for Chinese exports continues to present a key challenge to growth. Exports recorded a fourth consecutive month of contraction in August. In the same period, the value of products exported by industrial enterprises fell 4.5% year-on-year. China’s trade sector and industrial complex are likely to remain under pressure as major trading partners such as the U.S. and Euro Area continue to slow.
China is facing multiple headwinds, which we detail in the next section. Encouragingly, monetary easing is already underway, and policymakers have pledged additional support to help both consumers and businesses navigate current headwinds. Given that fiscal stimulus is likely in the pipeline, we expect activity will stabilize toward year-end. The IMF forecasts real GDP growth in China will moderate to 4.5% year-on-year in 2024.
In India, real GDP grew 7.8% in Q2 versus the prior year, an improvement from growth of 6.1% in the first quarter. Services remained the main engine of growth (+10.3%), while manufacturing (+5.5%) and agriculture (+3.5%) also made positive contributions. Since then, leading indicators suggest momentum has carried over into the second half of the year. The S&P Global India Services PMI remained at an elevated 60.1 in August, slightly lower than its 13-year high of 62.3 in the previous month. Meanwhile, the S&P Global India Manufacturing PMI pointed to a twenty-sixth straight month of growing factory activity. India is on track for real GDP growth of 6.3% in 2024, per IMF estimates.
Activity has proven resilient in Brazil and Mexico despite prolonged monetary tightening. However, the lagged effect of extensive interest rate increases and cooling external demand is expected to weigh on growth going forward. In 2024, the IMF forecasts real GDP to expand by 1.2% in Brazil and 1.5% in Mexico. Growth will likely moderate in most large emerging market economies in the year ahead and the region is expected to expand by 4.1% in annual terms, somewhat trailing its long-term average of 4.5%.
Key risks to outlook
1. China faces multiple headwinds
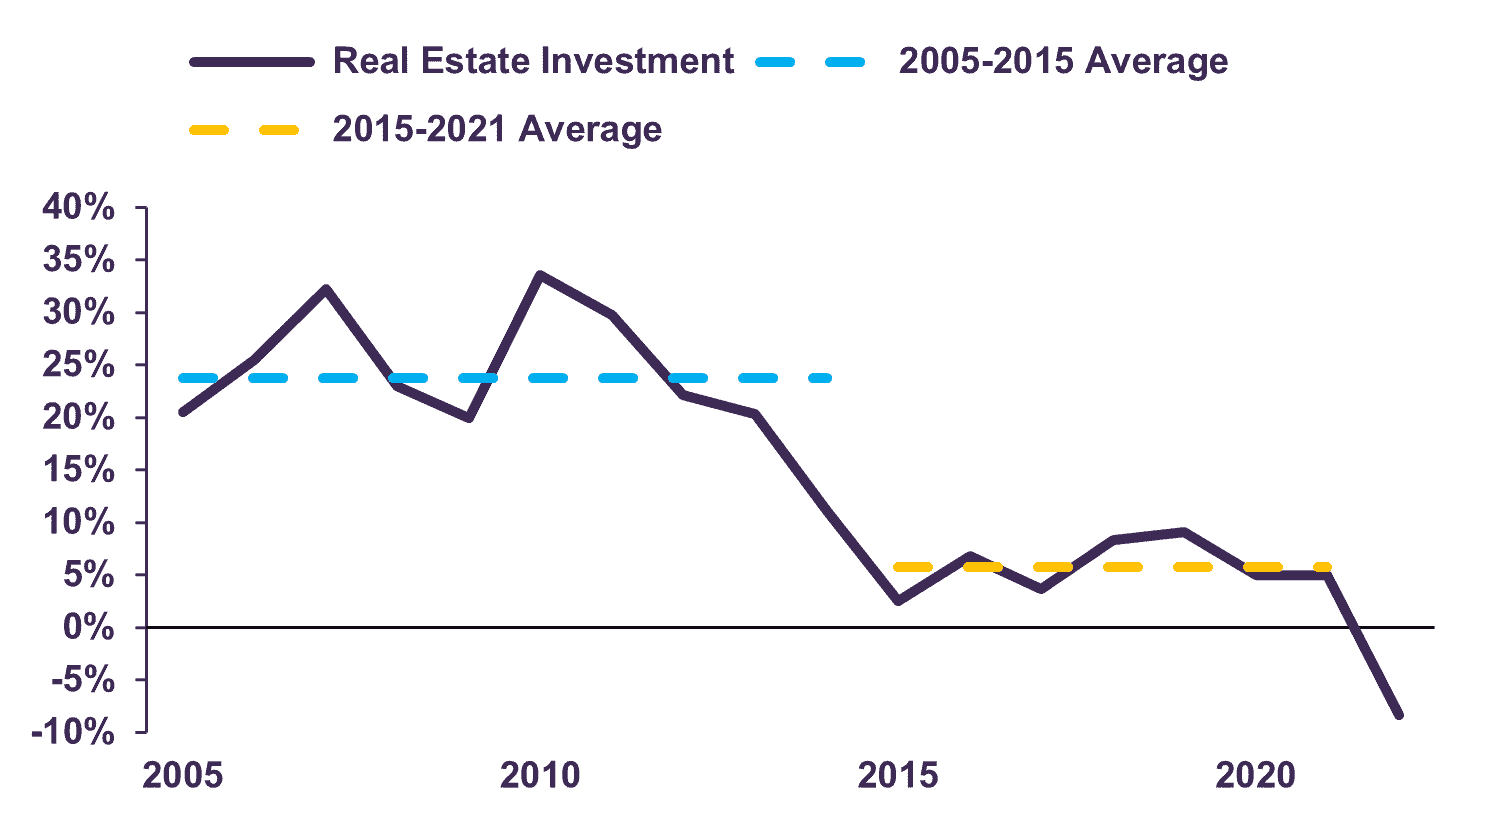
Chinese real estate investment expanded at a remarkable annual rate of 24% between 2005-2015, before moderating to a still impressive 6% over the subsequent seven years (Chart 2). However, following the introduction of restrictions on real estate developers’ funding and indebtedness in 2021 – known as the “three red lines” policy – China’s real estate market weakened. Once a key engine of the economy, the sector has instead become a significant drag on aggregate activity.
Although property market control measures have had a negative impact on near-term growth prospects, in our assessment, these restrictions should help foster stability over the long run. In addition, China now ranks equivalent to developed economies such as the U.K., Italy, and Japan in terms of living space per capita and its home ownership rate is among the highest in the world. A strong emphasis on boosting real estate investment therefore does not appear to be warranted anymore. Furthermore, on the demographic side, urban population growth is slowing due to China’s aging population and less migration from rural areas. The fundamentals of housing demand in China are structurally slowing.
We anticipate a challenging period of adjustment ahead. However, non-residential investment has offset the property market’s malaise. In the first eight months of 2023, total fixed asset investment grew by 3.2% year-on-year despite an 8.8% decline in real estate investment. Investment in manufacturing (+5.9%) and infrastructure (+11.3%) has remained robust.
On the trade front, we believe the current slump in exports is consistent with global growth dynamics. The bulk of China’s trade is with developed markets. During the pandemic, large stimulus programs led to surging goods demand in these economies. After two years of exceptional performance, we believe export growth is normalizing back to trend levels. At present, with imports slowing more rapidly than exports, it is worth noting that China’s trade balance is up 1.5% year-on-year to August, meaning net exports made a positive contribution to growth year-to-date despite the slowdown.
China’s property and export markets will continue to weigh on activity in the coming months. However, we caution against adopting an overly pessimistic view on China’s outlook. In our opinion, slowing growth amid an absence of inflationary pressures leaves the door open for Chinese authorities to provide further monetary and fiscal support to the economy.
Real Estate Investment (Annual Growth Rate)
2. Canada’s residential mortgage market
There has been growing apprehension about the risk posed by mortgage debt to the Canadian financial system. Borrowing costs have risen for variable-rate mortgage holders, as well as for those renewing fixed rate mortgages. As house prices have fallen, so too has homeowner equity. This confluence of factors has led to fears that Canadian lenders may be facing significant losses in their loan portfolios from residential mortgages.
While we acknowledge that some households may experience difficulties in meeting higher mortgage payments, we do not believe the residential mortgage market as a whole is seeing significant stresses. Mortgage loans in arrears remain near a multi-decade low despite higher interest rates. Thus far, households have met their payments, while banks have offered longer amortization periods to limit the increase.
Looking ahead, as maturing fixed rate mortgages are reset at much higher rates, this will put further pressure on households. In trying to estimate the capacity for mortgage holders to support these higher mortgage payments, the Bank of Canada (BoC) notes that savings have increased significantly for the vast majority of Canadians (Chart 3). This savings cushion will continue to provide a buffer for most households. In addition, The BoC’s surveys show that most mortgage holders are confident they will be able to make these higher payments[2].
Canadian Household Median Ratio of Liquid Savings to Monthly Spending
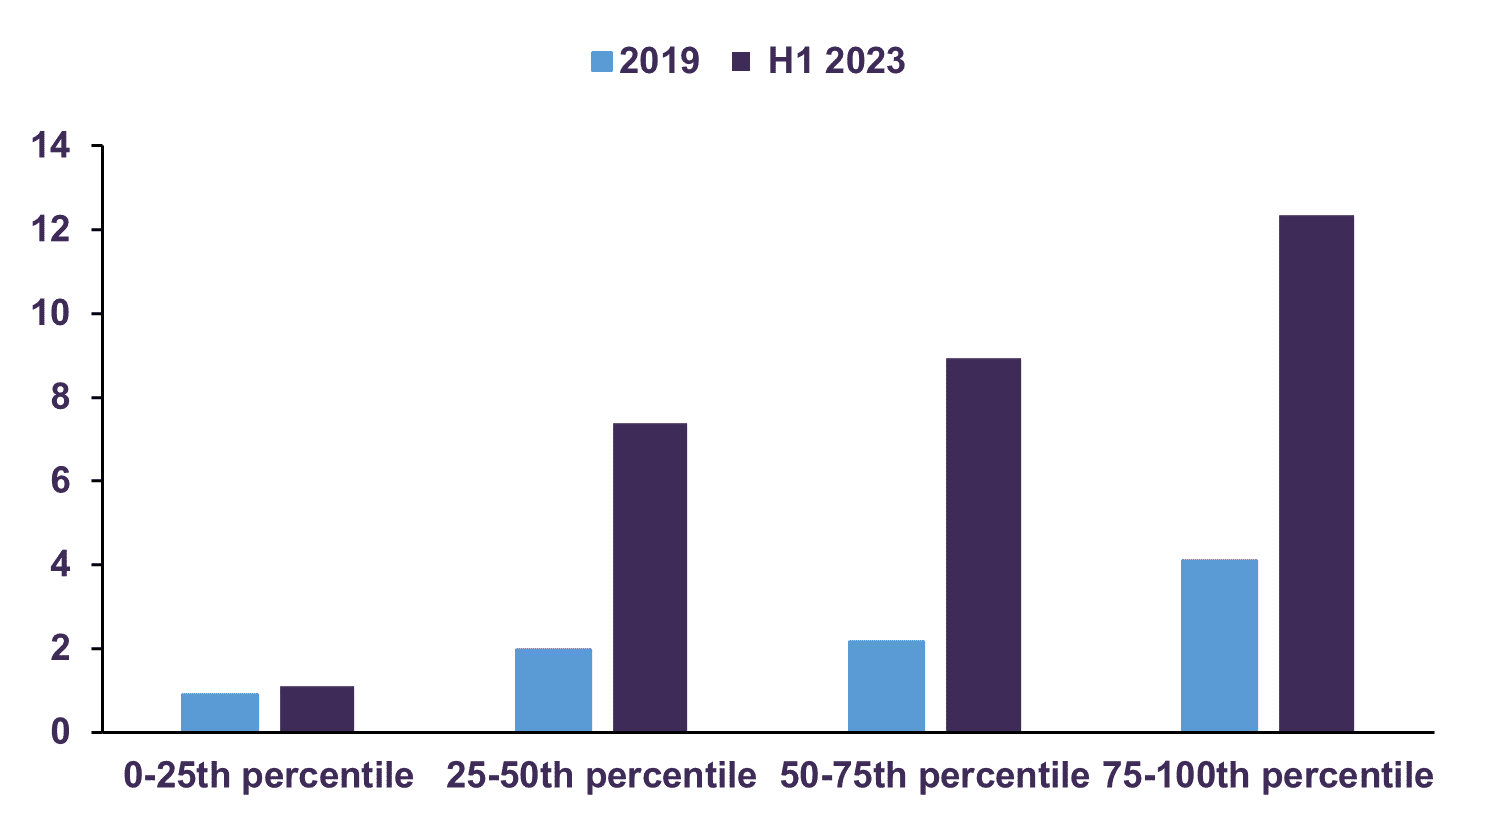
Source: Bank of Canada
Turning to the banking system, a breakdown of the Canadian banks’ loan books indicates that residential mortgages and home equity lines of credit (HELOC) account for about 45% of their total loans. Though this represents a material exposure for Canada’s major financial institutions, it should be noted that about one quarter of mortgages are insured by the CMHC, a government-owned entity. With respect to the uninsured mortgage loan book, credit metrics appear solid. The average loan-to-value ratio (LTV) is a reasonable 49% – this indicates that in aggregate, homeowners with uninsured mortgages have 51% equity in their homes, a healthy buffer. Indeed, the high-risk customer cohort, categorized as uninsured mortgage holders with a loan-to-value ratio greater than 70% and a FICO score less than 680, represents less than 1% of all uninsured mortgages.
While we remain attentive to the residential real estate exposures of Canadian banks, households’ savings buffer and mortgage debt metrics are reassuring. Structural features of the Canadian housing market, such as government-backed mortgage insurance, suggest that even in a slowdown, mortgage loan losses should remain low relative to other loan categories.
3. The risk of being too negative
At this juncture, most major central banks remain committed to maintaining a restrictive policy stance until inflation returns to target levels. While there is generally less concern about the risk from additional rate hikes at this point, many investors are fearful that the lagged impact of past interest rate increases will tip the economy into recession.
We continue to urge caution against adopting a binary recession or no recession framework for investment decision making. Indeed, U.S. economic readings from the first half of 2022 illustrate the folly of this perspective. The economy registered two consecutive quarters of negative real GDP in Q1 and Q2, satisfying a popular rule of thumb for determining a recession. However, conditions were broadly inconsistent with a real downturn, and consumer spending – the main driver of the U.S. economy – remained expansionary. Since then, real GDP has grown 2.4% despite persistent forecasts of an imminent downturn. Investors who exhibited patience in the face of volatility and remained invested throughout have been well rewarded.
There are a multitude of challenges to the global outlook, but there is also an upside risk that inflation converges to acceptable levels with minimal economic disruption. As the experience of the last two years proved, it is important to maintain a long-term perspective and avoid portfolio allocation changes based on short-term market gyrations.
Markets rise despite slowdown fears
Global equity markets declined somewhat in the third quarter, following a strong first half of the year. Year-to-date, the total return (in Canadian dollars) for the S&P/500 was 12.8%, the S&P/TSX 3.4%, MSCI Europe 8.4%, MSCI World Index 10.9% and MSCI Emerging Markets 1.6%. Given broad expectations of slowing economic activity in the year ahead, it is fair to question whether this positive performance is sustainable.
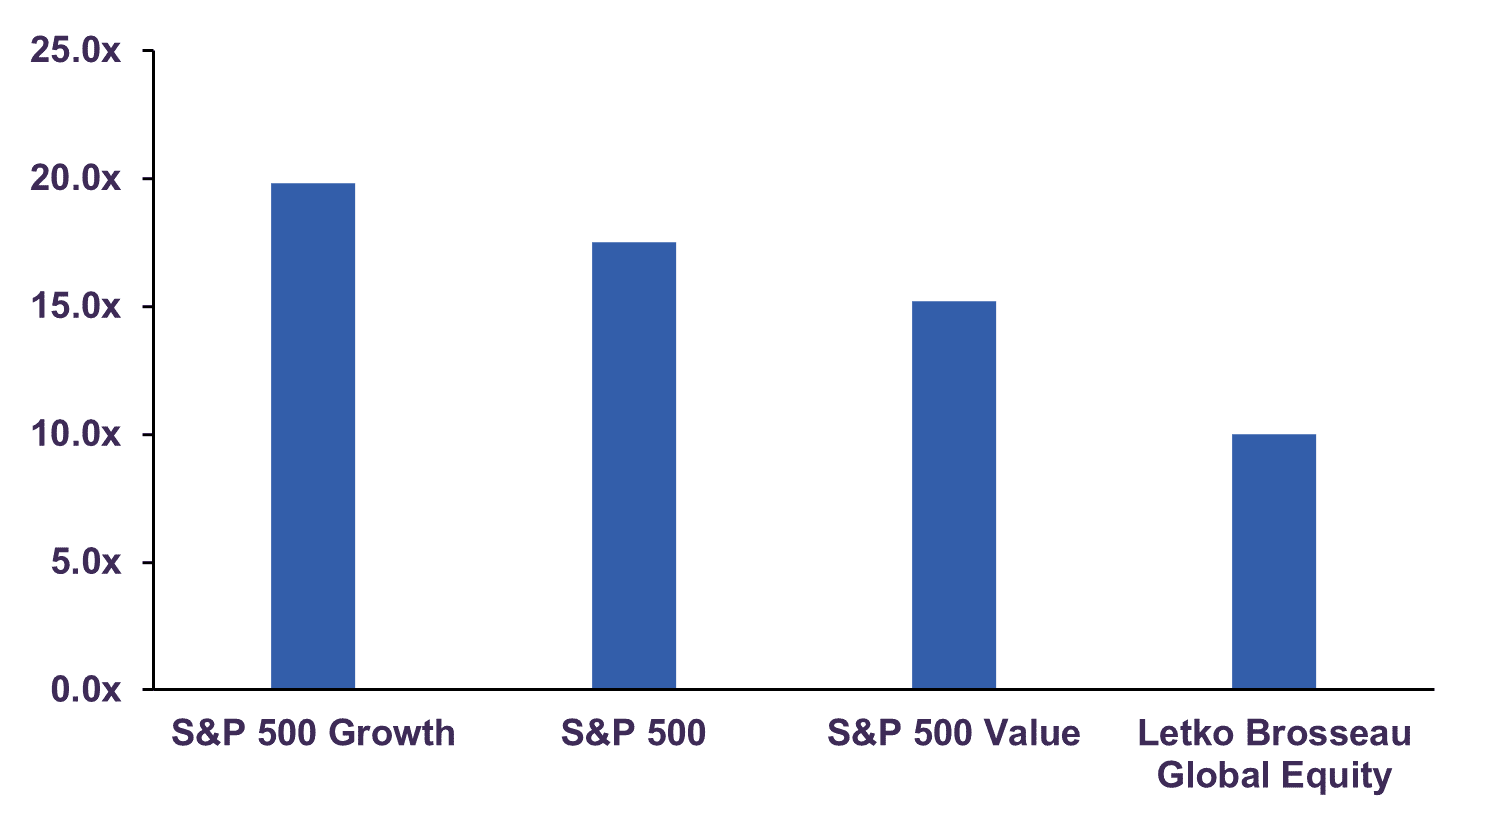
The S&P 500 currently trades at 17.5 times 2024 estimated earnings, somewhat above its long-term average of 15 times. However, earnings growth of 10% is anticipated for 2024, according to consensus S&P forecasts. This may prove to be overly optimistic given our expectations for the global economy to slow in the year ahead.
It must be noted that the S&P 500 Value Index trades at a more reasonable 15.2 times 2024 earnings, materially below the P/E multiple of 19.8 for the S&P 500 Growth Index (Chart 4). This valuation gap has been exacerbated by a handful of technology companies whose multiples have risen sharply this year on the back of generative AI exuberance, a topic we explored in July’s Portfolio Update.
We have recently taken the opportunity to reduce exposure in several holdings that have seen strong performance and whose valuations rose above levels consistent with company fundamentals based on our forecasts. Meanwhile, we are exercising discipline in redeploying capital; our portfolios cash reserves have risen somewhat. We believe our equity holdings continue to provide attractive growth prospects over a 3-5-year horizon. Our global equity portfolio trades at only 10 times forward earnings and provides a 3.8% dividend yield.
On the fixed income front, we have modestly extended the duration of our portfolios to take advantage of higher interest rates. Our exposure to high-quality, higher-yielding corporate bonds has also increased. With the inversion of the yield curve – the 30-year Canadian federal bond yields 3.86% while the 2-year federal bond yields 4.91% – longer-dated instruments not only carry increased additional interest rate risk, but they also offer less yield. Based on long-term assumptions of real economic growth and inflation, we believe the fair value 30-year yield is in a range of 4%-5%. This suggests Canadian long-term bonds are still expensive and are likely to destroy purchasing power over time. As a result, we continue to avoid exposure to instruments with a term above 10 years and have focused our purchases in the 5-10-year maturities.
Overall, we do not advocate for any material shifts in asset allocation and we are maintaining a moderate tilt towards equities over cash and bonds within balanced portfolios.
Forward Price-to-Earnings Ratio
The information and opinions expressed herein are provided for informational purposes only, are subject to change and are not intended to provide, and should not be relied upon for, accounting, legal or tax advice or investment recommendations. Any companies mentioned herein are for illustrative purposes only and are not considered to be a recommendation to buy or sell. It should not be assumed that an investment in these companies was or would be profitable. Unless otherwise indicated, information included herein is presented as of the dates indicated. While the information presented herein is believed to be accurate at the time it is prepared, Letko, Brosseau & Associates Inc. cannot give any assurance that it is accurate, complete and current at all times.
Where the information contained in this presentation has been obtained or derived from third-party sources, the information is from sources believed to be reliable, but the firm has not independently verified such information. No representation or warranty is provided in relation to the accuracy, correctness, completeness or reliability of such information. Any opinions or estimates contained herein constitute our judgment as of this date and are subject to change without notice.
Past performance is not a guarantee of future returns. All investments pose the risk of loss and there is no guarantee that any of the benefits expressed herein will be achieved or realized.
The information provided herein does not constitute investment advice and it should not be relied on as such. It should not be considered a solicitation to buy or an offer to sell a security. It does not take into account any investor’s particular investment objectives, strategies, tax status or investment horizon. There is no representation or warranty as to the current accuracy of, nor liability for, decisions based on such information.
This presentation may contain certain forward-looking statements which reflect our current expectations or forecasts of future events concerning the economy, market changes and trends. Forward-looking statements are inherently subject to, among other things, risks, uncertainties and assumptions regarding currencies, economic growth, current and expected conditions, and other factors that are believed to be appropriate in the circumstances which could cause actual events, results, performance or prospects to differ materially from those expressed in, or implied by, these forward-looking statements. Readers are cautioned not to place undue reliance on these forward-looking statements.
Concerned about your portfolio?
Subscribe to Letko Brosseau’s newsletter and other publications: