 Canada - FR
 U.S. - EN
Economic and Capital Markets Outlook
April 2022
- Due to the outbreak of war between Russia and Ukraine, we have revised our global growth expectation for 2022. We anticipate world real GDP growth of 3.4%, a moderately weaker pace of expansion than our previous forecast of 4.4%.
- Disruption to the supply of energy products and agricultural goods complicates already elevated inflation dynamics. Barring a sustained major escalation of events, we do not expect a derailment to global growth.
- The economies of the U.S. and Canada are well positioned to navigate the current situation. Large emerging markets such as China and India should also be able to tolerate these headwinds.
- In contrast, Russia and Ukraine’s economies will contract sharply, while Europe faces a higher risk of a downturn due to its trade links and reliance on Russian energy imports.
- We believe our portfolios are structured to tolerate the current mix of higher inflation and heightened volatility. Our holdings are well diversified, trade at reasonable valuations, and should offer meaningful value creation in the medium term.
- We are maintaining a tilt to equities within balanced portfolios while keeping bond duration short and credit quality high.
Summary
Russia’s invasion of Ukraine and the subsequent sanctions implemented by Western nations have introduced material downside risk to the global economic outlook. Prior to the outbreak of the war, most indicators of activity signaled another year of above-trend growth. The world economy expanded in February for a twentieth consecutive month according to the J.P.Morgan Global Composite Purchasing Managers Index (PMI). Since then, disruption to the supply of key commodities, namely energy products and agricultural goods, is complicating already elevated inflation dynamics and weighing on growth prospects.
With inflation levels at their highest in decades, major developed market central banks began to normalize monetary policy in the first quarter of this year. This is fueling concerns that the headwinds of geopolitical uncertainty, higher inflation and higher interest rates will tip the global economy into recession.
Though we acknowledge that the risks have risen, we believe it is premature to forecast a recession at this stage. The world’s major economies, with the possible exception of Europe, are resilient enough to withstand higher inflation. The world has tolerated higher expenditure on oil relative to GDP in the past and barring a sustained major disruption to energy and food-related commodities, we do not expect current events to derail global growth.
Economic prospects must be assessed on a regional basis given that spillovers from the Russia/Ukraine war differ by geography. Russia and Ukraine’s economies will contract sharply in the year ahead, but as they account for a combined 1.9% of world GDP, this alone will not cause a global recession. Europe faces a higher risk of a downturn due to its trade links and reliance on energy imports from Russia. Elsewhere, the economies of the U.S. and Canada are well positioned to successfully navigate the current situation given their momentum entering the crisis and relative insulation from the economic fallout. Large emerging markets, such as China and India, should also be able to tolerate these headwinds.
On the policy front, the upwards of $30 trillion in monetary and fiscal support injected into the world economy since the onset of the pandemic more than offset the initial $4 trillion decline in aggregate activity, and the global economy is already 7.2% above its pre-pandemic level. The cumulative impact of monetary stimulus is typically felt several months or years into the future. In addition, the multi-year nature of many fiscal support measures means that economies will continue to benefit for some time from the enormous amount of stimulus already in the system.
Though the prospect of an escalation in the conflict cannot be completely ruled out, nor can we ignore the potential for a serious and sustained disruption to key commodities, we view this scenario as a lower probability outcome. Our baseline forecast has been revised to moderately weaker global growth than our expectation at the beginning of the year. We expect current events will detract approximately 100 basis points from our previous global growth assumption. We now foresee world real GDP growth of 3.4% in 2022.
The global economy was on a stable footing
U.S. real GDP ended 2021 at 5.5% above its pre-pandemic level (Chart 1) and most indicators in early 2022 point to robust activity in the world’s largest economy. The S&P Global U.S. Composite PMI climbed to 58.5 in March driven by the quickest uptick in new orders in nine months. The labour market added 431,000 jobs during the same period, marking fifteen consecutive months of employment gains. Job creation surged in leisure and hospitality as the industry created 112,000 new positions. Retail businesses hired 49,000 new employees, bringing the total number employed in the sector to more than 200,000 people above the pre-pandemic amount. In the same period, the unemployment rate improved to a two-year low of 3.6%.
In Canada, real output increased 1.6% quarter-on-quarter during the last three months of 2021, boosting the economy to 0.3% above pre-pandemic levels. The labour market experienced a strong start to 2022. The economy gained 337,000 jobs in February, the largest number of jobs created in the prior seventeen months. Employment increased across all provinces, highlighting the breadth of the recovery. In turn, the rate of joblessness fell to 5.5% in February, its lowest level since January 2020. The S&P Global Canada Manufacturing PMI reached a new all-time high in March as the index’s subcomponents for output, new orders and employment all rose at faster rates.
Real GDP % Difference: Q4 2021 vs Q4 2019
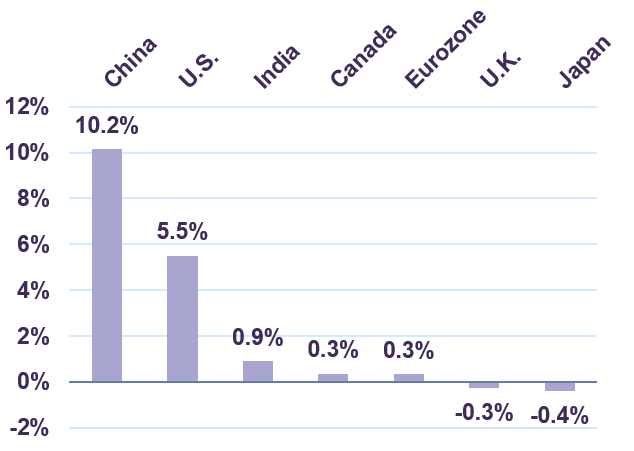
Sources: National statistics agencies
The Eurozone economy expanded 0.3% quarter-on-quarter in real terms during Q4 despite the Omicron variant wave. On an annual basis, real GDP grew 5.3% in 2021 and total output returned to the level recorded at year-end 2019. Labour market dynamics are constructive in the Eurozone. The five largest economies, i.e., Germany, France, Italy, Spain and the Netherlands, all recorded lower joblessness in February. This helped drive the unemployment rate for the entire region to a record low 6.8%.
In emerging markets, China’s real GDP expanded by 8.1% in 2021, its fastest pace in nearly a decade. After soaring 29.9% in nominal terms during 2021, exports are set to remain a key driver of growth in the year ahead. Through the first two months of 2022, exports from China increased 16.3% year-on-year, continuing a period of double-digit growth that began in Q4 2020. Elsewhere, real output in India grew by a five-year high of 8.2% in 2021. The S&P Global India Composite PMI increased to 53.5 in February, amid a faster expansion in India’s manufacturing and service sectors.
Russia – Ukraine war: direct economic impacts
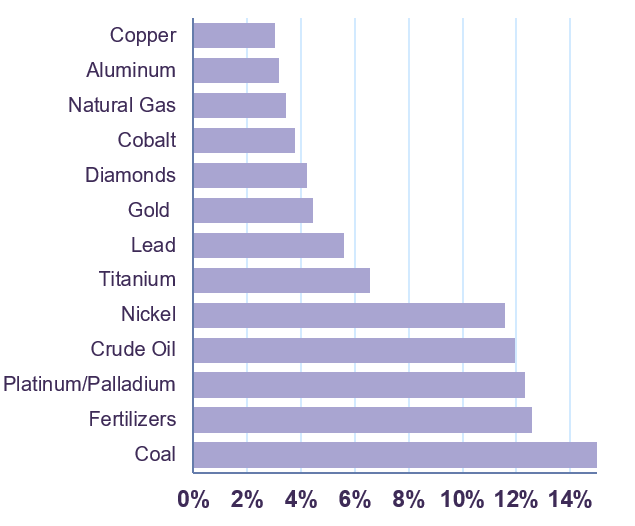
The combined economies of Russia and Ukraine represent only 3.5% of global GDP on a purchasing-power-parity basis, and in nominal terms, they account for an even smaller 1.9% share of world output. World merchandise trade with Russia and Ukraine as a percentage of world output is less than 0.5%. However, this understates the importance of the two countries in global commodity markets (Chart 2). While the war has pushed prices higher across a diverse range of commodities, the largest disruption to economic activity may stem from its impact on energy markets.
Russian Share of Global Exports (2020)
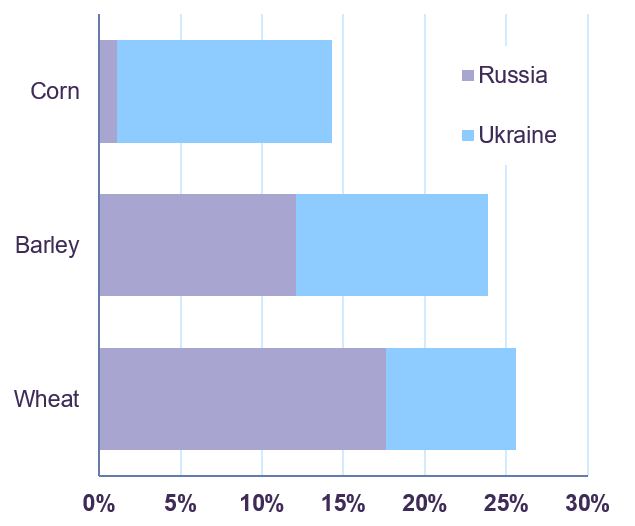
Share of Global Food Exports (2020)
In the E.U., Russia’s largest trading partner, total exports and imports to/from Russia account for only 0.5% and 0.9% of GDP respectively. However, disruptions to bilateral trade pose a risk to Europe’s energy security and aggregate economic activity. The E.U. imports most of its energy needs: 90% of natural gas consumed is sourced externally, of which 45% comes from Russia, and 97% of crude oil consumed, of which 27% is accounted for by Russia. A threat to the physical flow of energy products to Europe means supply shortfalls represent a greater risk to economic activity in the region than energy price inflation. The European Central Bank (ECB) estimates that a 10% cut in the supply of gas to the Euro Area would reduce real economic growth by 0.7%.
Direct trade impacts are minimal in the U.S. and Canada. Exports to Russia as a percentage of GDP for both countries are less than 0.1%. As net exporters of energy products, however, both countries may see improvements in their terms of trade as well as increased energy-related capital expenditures and job creation. About 2.0% of China’s total trade is with Russia compared to 0.9% for India, but the world’s two largest emerging market economies are net oil importers. With reserves of $3.2 trillion (19.1% GDP) and $619 billion (21.0% GDP) respectively, both economies should be able to absorb the impact of a period of temporarily higher energy prices.
The Russia-Ukraine war is also causing strain in agricultural commodities. Russia and Ukraine combined account for one-quarter of global wheat and barley exports and almost 15% of corn exports. Developing economies such as Egypt, Turkey, Indonesia and Bangladesh are the primary destinations of these exports and the most exposed to shortages. Alongside higher energy prices, costlier foodstuffs will add to already-elevated inflation globally.
Russia – Ukraine war: indirect economic impacts
Compared to the acute risks of supply shortfalls in select economies, food and energy price inflation presents global challenges. In advanced economies, such as the U.S., Canada, and the Eurozone, the weight of food and energy in Consumer Price Indexes is about 20-25% of consumption baskets. In emerging markets, these weights are often higher. In the short term, the global economy faces an inflation-induced drag on consumption.
In the U.S., real disposable personal incomes fell 1.4% year-on-year in the fourth quarter, as wage growth failed to offset the absence of Covid-19 relief programs and elevated inflation. Similarly, Canadian real household disposable income shrank 2.9% in Q4 as government transfers to households returned to pre-pandemic amounts. By pushing inflation higher, energy and food prices will exacerbate the slowdown in real incomes, tempering the outlook for consumption growth. Meanwhile, food and energy cost pressures will also act as a tax on other consumer spending as households are forced to scale back spending elsewhere.
Although consumer spending will moderate, growth should prevail in most major economies. We note that the world has seen higher spending on energy and food relative to incomes in the past. In the U.S., energy expenditure as a share of nominal disposable income is well below its long-term average of 5.3% (Chart 3).
U.S. energy expenditure as a % of disposable personal Income
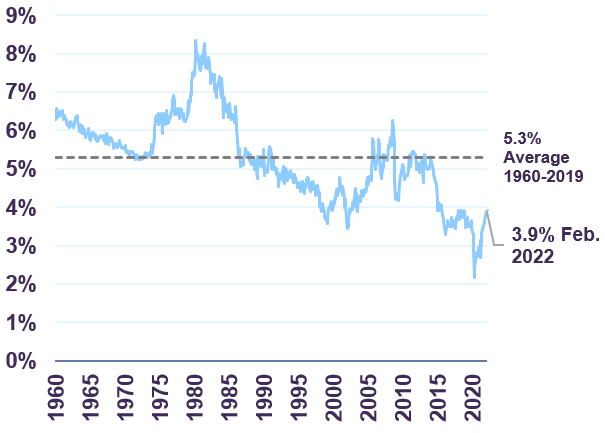
The same is true for food expenditure, which accounts for 7.0% of disposable income compared to its pre-pandemic level of 9.9%. Savings rates have moderated back to average levels in the U.S. and Canada, but excess savings – the amount accumulated above pre-pandemic savings trends – still represent more than 10% of GDP in both countries. This suggests households may have some buffer against rising food and energy prices.
Prospects for consumer spending are not uniform, however. Among major economies, household real incomes will likely be more depressed in Europe where energy price pressures are most intense. In contrast, annual inflation of only 0.9% in February suggests that Chinese consumers remain somewhat insulated from the global dynamics of costlier energy and food.
Energy price spiral possible, but likely short-lived
Oil prices breached $130 per barrel for the first time in more than a decade during early March. While prices have since tempered, there is still much uncertainty about the full effects of a sanctions-induced Russian energy export curtailment. We believe a run-up in energy prices is technically possible in the short-term, though unlikely to be sustained.
European sanctions against Russia mostly exempt energy products, yet many Western-domiciled companies (oil companies, oil traders, shipping companies, banks and insurers) are avoiding transacting with Russia. This is due to uncertainty as to the scope of future sanctions, payment, financing and insurance disruptions, as well as reputational risks. We estimate there is a supply shortfall of about 2-3 million barrels per day (mbd) due to these conditions, or roughly 2-3% of global supply.
The extent and duration of supply disruption will depend on several factors. Marginal relief may come from buyers gaining a better understanding of how to navigate sanctions regimes, but reputational risks are elevated. Russian energy products may also be rerouted to more willing buyers, specifically in Asia, but logistical challenges lead us to believe only a limited amount of crude can be cleared this way. In our assessment, the most likely supply solution will come from excess capacity outside of Russia.
Some of this additional supply can be brought to market relatively quickly. For instance, coordinated Strategic Petroleum Reserve releases, such as the 60 million barrel release announced at the beginning of March by International Energy Agency (IEA) members, can add about 1 mbd of crude oil supply through April and further such releases are possible.
With most of the world’s spare production capacity residing in Saudi Arabia and the United Arab Emirates, increased production from these key players will be required for a sustainable offset to the shortfall. There is also the possibility of additional Iranian barrels, should that country return to a nuclear agreement with the West. However, given that such an increase in production would take time, there is a risk that over the next several months, the oil market may be short of supply, risking a further rise in prices as inventories – already low by historical standards – are drawn down. But we think rising supply from the aforementioned sources, in combination with demand destruction from higher oil prices, implies that a price run-up is likely to be shortlived. In the end, all parties clearly have a mutual interest in finding a timely solution given that periods of persistently high oil prices lead to substitution and structurally lower consumption. In our assessment, an upward spiral in energy prices is possible in the short term, but is unlikely to be sustained.
Monetary policy normalization will be gradual
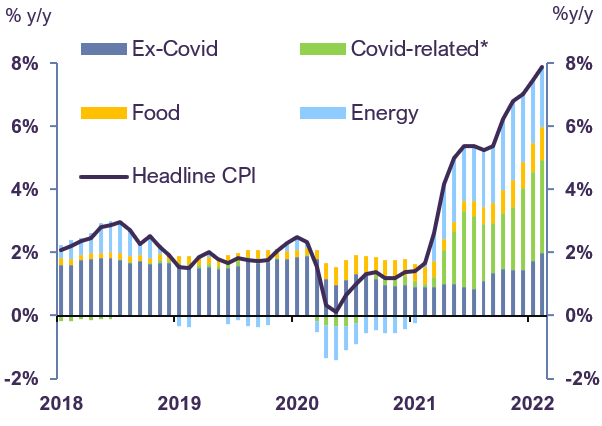
We expect the commodity price shock from the Russia-Ukraine war to drive headline inflation higher in the near term. The U.S. Consumer Price Index (CPI) for all items accelerated to 7.9% year-on-year in February, and we estimate that the short-term impact of higher energy and food prices could add around 2% to CPI, implying headline inflation near 10%. While inflation could persist at above-trend levels for some time, we believe the shock to be temporary and the risk of runaway inflation is low.
Energy costs and food prices made significant contributions to headline inflation in the U.S. during February (Chart 4). The near-term trajectory of commodity prices remains unknown given uncertainty about future sanctions, but there are important implications for core inflation – the measure of inflation targeted by central banks which excludes these items. Spending on essentials such as food and energy tends to be inflexible. Households will likely have to pare back discretionary spending, possibly causing price pressures to ease in non-food and energy items – core items by definition. The pricing power that companies enjoyed over the last several quarters may diminish as the demand for goods and services decreases, limiting the pass-through risk to core inflation.
U.S. Consumer Price Index
Source: U.S. Bureau of Economic Analysis, Letko Brosseau
Meanwhile, high core inflation remains largely attributable to a handful of goods and services specifically impacted by the pandemic. Excluding these items, the U.S. core inflation rate is only 0.75% above its long-term average. As detailed in our January 2022 Economic and Capital Markets Outlook, price pressures in these pandemic-impacted goods and services should prove temporary.
While inflation could persist at above-trend levels for some time, we are confident that the risk of runaway inflation is low. In turn, we foresee a gradual, rather than abrupt, normalization of monetary policy in advanced economies. Central bank actions taken to date confirm this view.
The U.S. Federal Reserve and the Bank of Canada both raised their benchmark interest rates by 25 basis points to a still stimulative 0.5% after nearly two years of an effective lower bound policy setting. In Europe, ECB policy rates are unchanged from record lows and the central bank recently reaffirmed its commitment to maintain extraordinary asset purchases of €30 billion per month on average until Q3. Global growth will continue to benefit from developed markets’ accommodative monetary policy in 2022.
Markets fluctuate amid uncertainty
Equity markets retrenched from near-record highs in the first quarter of 2022 amid fears of an escalation in the Russia-Ukraine war and rising inflation. The risk that the global economy could fall into recession is perceived to be rising. While the total return for the S&P/TSX Index was +3.8% year-to-date, the S&P 500 (-5.7%), MSCI World
(-6.2%) and MSCI Emerging Markets (-8.0%) all recorded pullbacks. In general, our portfolios have fared better than the indexes during the period.
We entered this volatile period with limited investments based in Russia and Ukraine in our Emerging Markets Equity Fund. Prior to the invasion, we took an active decision to exit from our positions in two Russian companies. With remaining exposure in Russia and Ukraine close to zero, our global equity mandate is well insulated from direct exposure to either market.
Further, we believe our portfolios are well positioned to tolerate the current mix of higher – but not runaway – inflation and heightened volatility. Our holdings are diversified by geography and industry, trade at reasonable valuations, and should offer meaningful value creation in the medium term. The Letko Brosseau global equity portfolio is currently valued at 11 times 2022 earnings and provides a relatively attractive 3% dividend yield.
In contrast, we continue to view the risk/return prospects of bonds as unattractive. Besides failing to provide adequate purchasing power preservation, long-duration instruments remain acutely vulnerable to the ongoing normalization of monetary policy.
The 30-year Government of Canada bond suffered a 15% loss over the last three months as yields rose 70 basis points. Should rates rise by just another 1%, the bond would incur an additional capital loss of 21%. Capital preservation and low duration remain the focus of our fixed income strategy.
Our base case forecast is for global economic activity to continue to expand in the year ahead. We are maintaining a tilt toward equities over bonds and cash within balanced portfolios.
Legal notes
All dollar references in the text are U.S. dollars unless otherwise indicated.
The information and opinions expressed herein are provided for informational purposes only, are subject to change and are not intended to provide, and should not be relied upon for, accounting, legal or tax advice or investment recommendations. Any companies mentioned herein are for illustrative purposes only and are not considered to be a recommendation to buy or sell. It should not be assumed that an investment in these companies was or would be profitable. Unless otherwise indicated, information included herein is presented as of the dates indicated. While the information presented herein is believed to be accurate at the time it is prepared, Letko, Brosseau & Associates Inc. cannot give any assurance that it is accurate, complete and current at all times.
Where the information contained in this presentation has been obtained or derived from third-party sources, the information is from sources believed to be reliable, but the firm has not independently verified such information. No representation or warranty is provided in relation to the accuracy, correctness, completeness or reliability of such information. Any opinions or estimates contained herein constitute our judgment as of this date and are subject to change without notice.
Past performance is not a guarantee of future returns. All investments pose the risk of loss and there is no guarantee that any of the benefits expressed herein will be achieved or realized.
The information provided herein does not constitute investment advice and it should not be relied on as such. It should not be considered a solicitation to buy or an offer to sell a security. It does not take into account any investor’s particular investment objectives, strategies, tax status or investment horizon. There is no representation or warranty as to the current accuracy of, nor liability for, decisions based on such information.
This presentation may contain certain forward-looking statements which reflect our current expectations or forecasts of future events concerning the economy, market changes and trends. Forward-looking statements are inherently subject to, among other things, risks, uncertainties and assumptions regarding currencies, economic growth, current and expected conditions, and other factors that are believed to be appropriate in the circumstances which could cause actual events, results, performance or prospects to differ materially from those expressed in, or implied by, these forward-looking statements. Readers are cautioned not to place undue reliance on these forward-looking statements.
The MSCI information may only be used for your internal use, may not be reproduced or redisseminated in any form and may not be used as a basis for or a component of any financial instruments or products or indices. None of the MSCI information is intended to constitute investment advice or a recommendation to make (or refrain from making) any kind of investment decision and may not be relied on as such. Historical data and analysis should not be taken as an indication or guarantee of any future performance analysis, forecast or prediction. The MSCI information is provided on an “as is” basis and the user of this information assumes the entire risk of any use made of this information. MSCI, each of its affiliates and each other person involved in or related to compiling, computing or creating any MSCI information (collectively, the “MSCI parties”) expressly disclaims all warranties (including, without limitation, any warranties of originality, accuracy, completeness, timeliness, non-infringement, merchantability and fitness for a particular purpose) with respect to this information. Without limiting any of the foregoing, in no event shall any MSCI Party have any liability for any direct, indirect, special, incidental, punitive, consequential (including, without limitation, lost profits) or any other damages. (www.msci.com).
Concerned about your portfolio?
Subscribe to Letko Brosseau’s newsletter and other publications: