 Canada - FR
 U.S. - EN
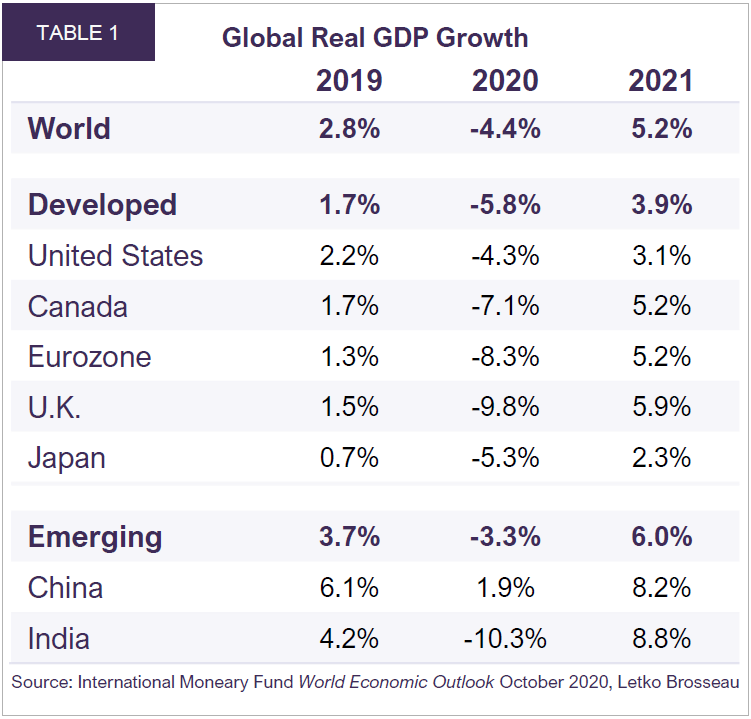
- Economic activity is on track for a strong post-pandemic rebound. The IMF forecasts global real GDP will expand by 5.2% in 2021.
- U.S. domestic demand and robust policy support are boosting activity. We expect U.S. real GDP to increase 3.1% in 2021.
- Extraordinary stimulus as well as positive trends in employment and wages contribute to our constructive outlook for the Canadian economy. We anticipate real GDP growth of 5.2% in the year ahead.
- Eurozone monetary and fiscal stimulus is set to reach 49.9% of GDP, one of the largest pandemic response efforts in the world. We forecast real GDP will advance 5.2% in 2021.
- With China leading the region, the IMF expects emerging market real GDP to grow 6.0% in 2021.
- Global equity markets closed 2020 at new highs, fueled by the emergence of several successful vaccines, continued monetary and fiscal support, and mounting evidence of a strong economic recovery.
- We continue to avoid exposure to exorbitantly-priced areas
of the market. Our equity portfolios trade at reasonable multiples, pay an attractive dividend yield and are
well-positioned for the recovery. - Long-term bonds offer low income and little purchasing power protection. Our fixed income portfolios are conservatively managed to preserve capital.
Summary
This past year was like no other. The global social disruption and economic damage that followed from the pandemic were without precedent. However, what is truly remarkable is how quickly we are turning the corner.
While the world had little knowledge about the virus in early January 2020, by the end of the year there were already several, fully-tested vaccines for COVID-19 available for emergency use. Vaccination campaigns for high-risk populations have begun and around 800,000 doses were administered in the U.S. during the first 10 days. Authorities are forecasting that up to 100 million Americans may be vaccinated by March 2021, with the remaining population likely to receive their dose by the end of the second quarter. While the pandemic led to the deepest recession since the 1930s, it turned out to be one of the shortest, thanks to the timely and aggressive stimulus measures enacted around the world. In the same year that the S&P 500 recorded the fastest bear market on record, it subsequently reached new all-time highs.
There is mounting evidence that the global economic recovery is on track, despite the marginal tightening of restrictions in response to a second wave of the virus. To date, authorities have implemented targeted strategies to slow the pandemic’s spread. Important signposts, such as income growth and job creation, show that labour markets are healing. Global manufacturing is robust and commodity prices are strengthening. Meanwhile, having already announced measures totalling an extraordinary 33% of global GDP, monetary and fiscal authorities are pressing ahead with additional stimulus to further boost economic activity.
These combined factors lead us to believe that the year ahead could deliver the strongest global expansion in more than a decade. The IMF forecasts that global real GDP growth will accelerate to 5.2% in 2021, a sharp rebound from the 4.4% contraction in 2020 (Table 1).
U.S. households bolstered by wage growth and stimulus
The U.S. economy recorded its sharpest acceleration in history during the third quarter, with real GDP increasing by 7.5% from the second quarter. Households were a key factor in this expansion. Consumer spending increased 10.0% in nominal terms against Q2. Even in the face of renewed virus containment policies, consumption indicators remain positive.
In November, average hourly earnings increased 4.4% year-on-year and weekly hours worked rose 1.5%. Despite an elevated unemployment rate of 6.7%, household disposable income is up a solid 4.3% against a year ago. Strong wage growth and government income-replacement schemes have effectively offset the negative impact of millions of job losses. With a robust savings rate of 12.9% and household net worth of $124 trillion, an all-time high, U.S. consumers are well-positioned to weather the second wave.
Sales data—from retail to large ticket items—is reflecting strong consumer spending. Retail sales soared 32.4% between April and November and sit 4.1% higher than the same time last year. Strong sales of building materials, up 18.2% in year-on-year terms, as well as robust vehicle sales, up 6.4% year-on-year, contributed positively to retail activity in November. Meanwhile, new home sales surged 20.8% against a year ago and existing home sales are up 25.8% year-on-year, boosted by consumer strength and historically low mortgage rates. Once the U.S. achieves a level of vaccination that allows for a broad-based reopening, we expect the travel and hospitality sectors to benefit from pent-up demand, which will also help drive growth higher in 2021.
Elsewhere, the U.S. industrial sector is staging an impressive comeback. Total factory orders, durable goods orders and manufacturing shipments have each posted six consecutive months of expansion to October. The Markit Manufacturing PMI climbed to 57.1 in December, the strongest measure of industrial growth in more than five years. Activity restrictions have generally spared manufacturing to date, suggesting the industrial sector’s resilience could help cushion the impact of a second wave on the overall economy.
In the 11 months to December, the U.S. Federal Reserve provided an estimated $6.2 trillion in monetary stimulus, along with 150 basis points of policy rate cuts. These efforts were essential in averting a full-blown financial crisis during the early stages of the pandemic. An absence of inflationary pressures will allow monetary policy to remain accommodative well into the recovery. On the fiscal front, Congress recently approved a $900 billion COVID-19 aid bill, with the objective of sustaining the recovery until vaccine-related activity normalization occurs later in the year.
In our assessment, the U.S. economy possesses the momentum and policy support required to absorb the headwinds from the second wave. The country will likely be among the first to achieve large-scale COVID-19 immunization in 2021. We forecast U.S. real GDP will expand by 3.1% in 2021.
Canada poised for a breakout 2021
The Canadian economy emerged from recession in Q3. Real GDP expanded 8.9% quarter-on-quarter, the strongest rebound on record. Consumer spending increased 12.8% on continued improvements in employment and incomes. During November, 62,000 jobs were added, marking the seventh consecutive month of employment gains. Around 80% of jobs lost between February and April have been restored, while the unemployment rate has fallen to 8.5% from its mid-crisis peak of 13.7%. Wage data is also encouraging, with average hourly earnings for all employed persons up 5.4% in the three months to November. The wage improvement extends to both services-producing and goods-producing sectors, which are up 6.1% and 2.3% respectively.
Retail sales increased 7.5% year-on-year in October, reflecting the resilience of Canadian consumers. Meanwhile, the housing market remains buoyant with home sales up 32.1% and prices up 13.8% against a year ago in November. The outlook for the industrial sector is similarly positive. The Manufacturing PMI has remained in plus-50 territory since July, pointing to strong factory growth.
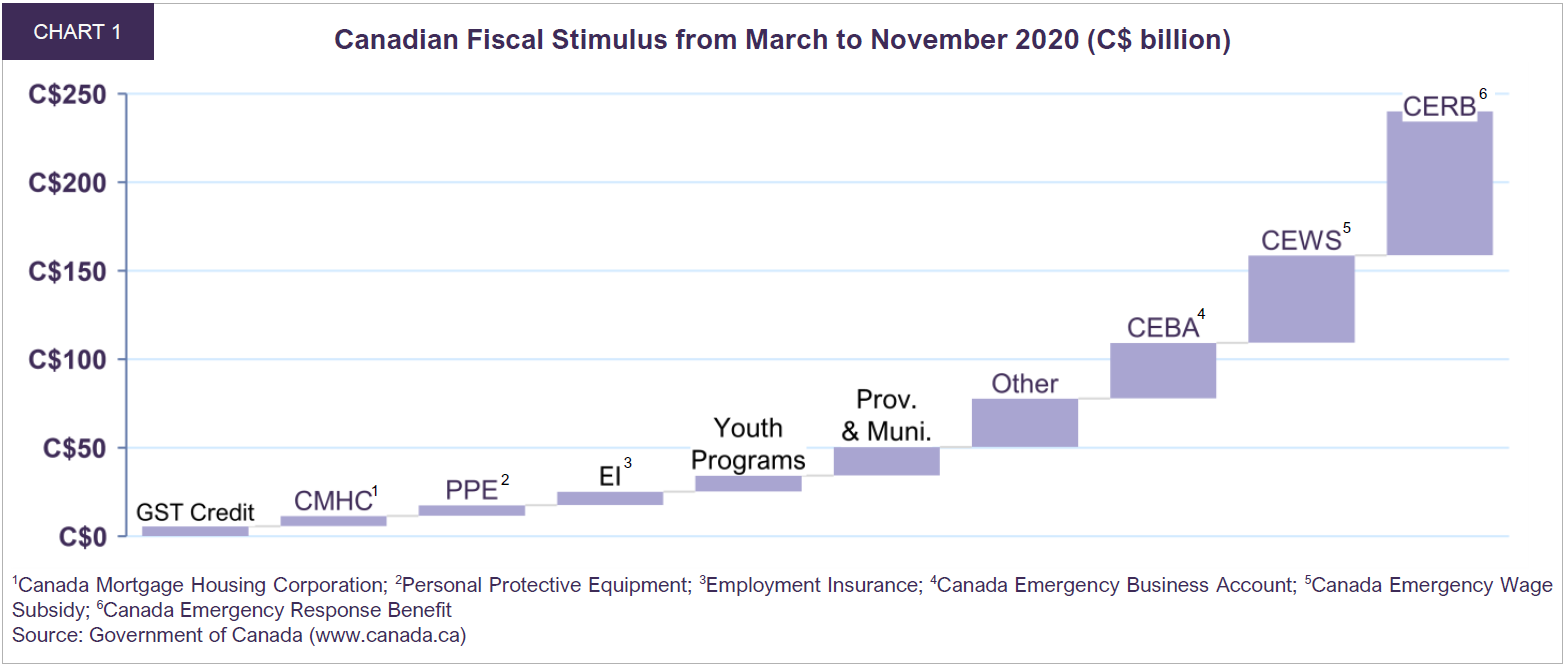
The federal government injected C$240 billion between March and November, just shy of C$1 billion per day, in stimulus to Canadian households, businesses, and government entities (Chart 1). A further C$100 billion has been announced as a post-pandemic response plan, suggesting that the Canadian economy will benefit from extraordinary stimulus for some time to come. Similarly, the Bank of Canada’s commitment to ultra-low interest rates and its C$4 billion per week bond purchase program will provide ample liquidity going forward.
With expectations of large-scale policy support and a vaccine rollout enabling a broad-based reopening, the Canadian economy is forecast to register real GDP growth of 5.2% in 2021, a 20-year high.
Europe weathers new restrictions
Real GDP in the Eurozone grew 12.5% quarter-on-quarter in Q3, rebounding from a record 11.7% contraction in the second quarter. Nominal household spending surged 13.6% in Q3 period as restrictions eased. Strong employment and wage growth helped drive this uptick in consumption. The number of employed persons grew 1.0% quarter-on-quarter and wages jumped 2.2% against a year ago. Despite a marginal tightening of mobility restrictions since the end of the third quarter, consumer spending is sound. In October, retail sales rose 8.2% year-on-year in Germany, 5.9% in France, 2.9% in Italy while total Eurozone retail sales grew 4.3%.
In Germany, Europe’s largest economy, strong industrial sector activity helped the country bounce back from recession. Factory output expanded 3.2% in October versus the prior month, a sixth consecutive monthly increase. In the same period, new orders increased 3.5% month-on-month. With the manufacturing PMI signalling expansion since July, Germany’s industrial recovery is expected to contribute positively to growth going forward.
European manufacturing has been less impacted by the latest wave of public health restrictions than the services industry. The Eurozone Manufacturing PMI has remained above 50 since July, indicating a sustained expansion since summer. On balance, the industrial sector’s resilience should help provide a partial offset to losses in hospitality and non-essential retail while closures remain in place.
In addition to steady consumer demand and solid manufacturing activity, the Eurozone’s economic outlook is also benefitting from one of the largest monetary and fiscal pandemic response efforts in the world. The European Central Bank’s €1.85 trillion Pandemic Emergency Purchase Programme (PEPP) will run to at least March 2022, while reinvestment of maturing PEPP securities will continue until at least the end of 2023, well into the region’s recovery. The ECB also announced an extension of its targeted longer-term refinancing operations (TLTROs) to June 2022. The TLTRO supplies long-term funding to banks at the very attractive rate of -1.0%. On the fiscal front, the combined spending of the 19 Eurozone governments totals €4.27 trillion to date, with an additional €800 billion currently under discussion. In sum, total Eurozone monetary and fiscal stimulus is projected to reach 49.9% of GDP. These efforts will help bridge the gap while the most hard-pressed areas of the economy await a vaccine-related revival. We anticipate the Eurozone will grow 5.2% in 2021.
The new E.U.-U.K. Trade and Cooperation Agreement (TCA) removes the risk of a no-deal Brexit, but uncertainty will continue to cloud the U.K.’s medium-term outlook as further negotiations are likely to follow. The country’s exports to the European Union (14% of U.K. GDP), business investments (14% of U.K. GDP), and the financial industry (6% of U.K. GDP) may all experience disruption. In the short-term however, the U.K. is expected to benefit from a post-pandemic rebound. The IMF forecasts real GDP growth of 5.9% in the year ahead.
China leading global growth
In China, a variety of indicators point to a strong year-end 2020 and solid economic momentum in 2021. During the third quarter, real GDP expanded 4.9% year-on-year, accelerating from 3.2% in Q2. Exports soared 21.1% in November versus a year ago, reflecting rising holiday season demand from Western trading partners as well as a continued need for medical equipment and work-from-home electronics. Export growth has now accelerated for six consecutive months, with November marking the fastest expansion since the beginning of 2018. Thanks to this robust level of activity, China’s trade surplus reached $75.4 billion, the largest on record. The surplus vis-à-vis the U.S. is now $37.4 billion, also an all-time high.
Industrial sector strength, a key driver of the recovery to date, shows no signs of abating. Industrial production grew 7.0% year-over-year in November, the seventh straight month of expansion. The Manufacturing PMI reached 53 in December, the eighth consecutive monthly increase in factory activity.
There are encouraging signs that China’s recovery is extending to domestic consumption. Retail sales rose 5.0% year-on-year in November, the most in 11 months. Strong passenger vehicle sales and home sales in November, up 11.7% and 9.5% respectively against the same period last year, suggest post-pandemic consumer demand is robust. In contrast, the travel, hospitality and entertainment industries will likely remain below pre-pandemic levels until widespread inoculation occurs, as is the case elsewhere in the world.
While fiscal stimulus was key to China’s recovery, monetary accommodation has also played a crucial role. At the peak of the health crisis in Q1, loan growth slowed to 3% year-on-year, from 20% a year ago. Loan growth has since reaccelerated to 19% in October, as a result of aggressive easing by the People’s Bank of China.
China is poised to maintain its position as a global leader in COVID-19 containment and economic performance. With solid momentum entering the new year, the IMF forecasts real GDP in China will grow by 8.2% in 2021, the economy’s fastest expansion in 10 years.
Emerging markets returning to form
In India, following a severe 23.9% year-on-year drop in real GDP in Q2, activity declined by 7.5% year-on-year in Q3. The economy is on course for one of the largest contractions among major emerging markets in 2020. A protracted national lockdown during the first wave of the virus has been followed by regional containment strategies. There are some indications, however, that India has begun to turn the corner.
Industrial production in October recorded its fifth increase in the last six months and growth is positive in year-on-year terms. In December, the Manufacturing PMI registered its fifth consecutive expansion. Against a backdrop of prolonged monetary accommodation by the Reserve Bank of India and total virus relief spending of 15% of GDP, India should return to high growth in 2021. Real GDP is expected to increase 8.8% year-on-year, per IMF estimates.
Large emerging market economies such as Brazil, Indonesia and Mexico also posted meaningful rebounds in the third quarter. In the near term, the spread of COVID-19 still poses a risk to still fragile recoveries within emerging markets, but, on balance, improvement is underway. With China leading the region, the IMF expects emerging market real GDP to grow 6.0% in 2021.
Commodities bounce back
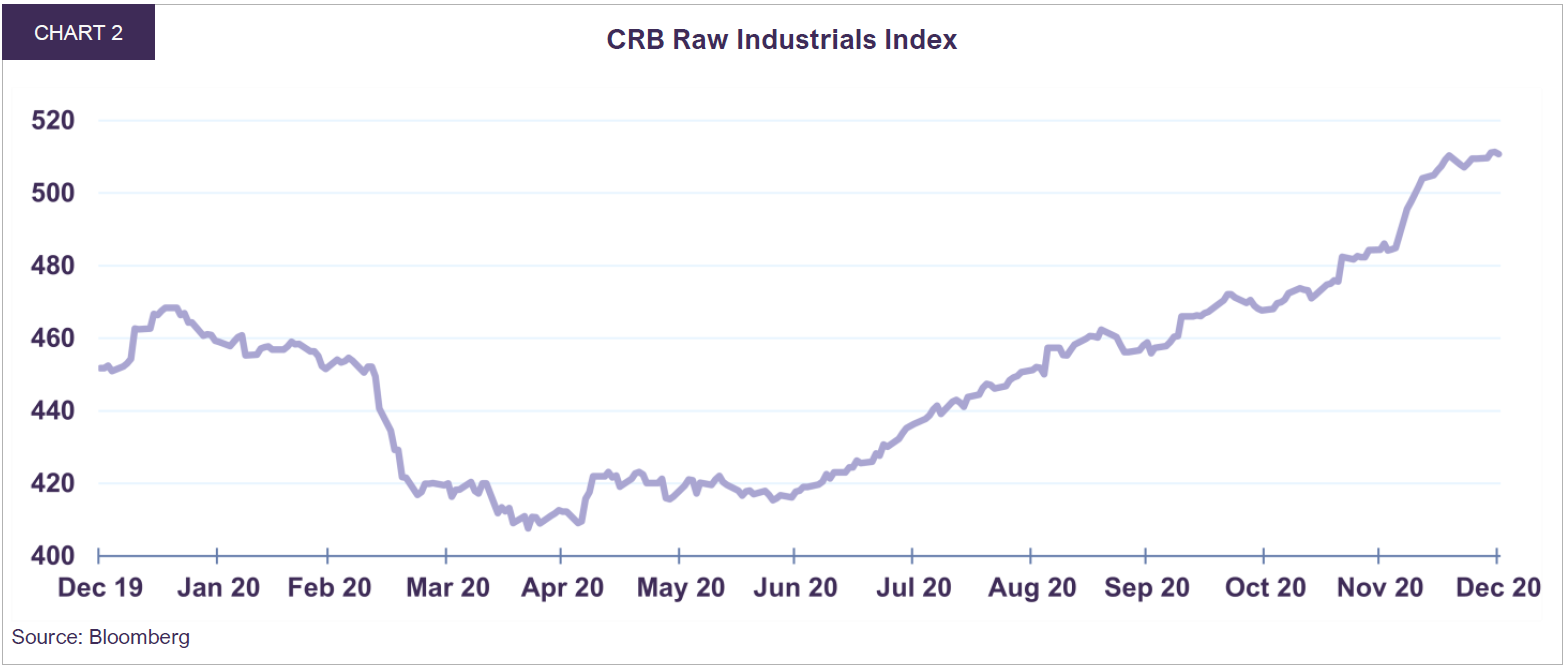
Commodity markets, a bellwether of global activity, are in a strong upturn (Chart 2). Some of the biggest price gainers of recent months are industrial inputs such as iron ore up 56.2% since end-April, copper (49.5%) and zinc (41.3%). Industrial metals are benefitting from a rebound in global manufacturing and strong Chinese demand. The Commodities Research Bureau (CRB) Raw Industrials Index, a series which tracks 13 commodity prices, is up 25.3% since bottoming in April. Energy prices have also advanced with Western Texas Intermediate (WTI) and Western Canadian Select (WCS) rising 157.3% and 193.0% respectively since end-April.
Prices of other materials, such as lumber, are also seeing notable rebounds from pandemic lows. Strong residential construction and renovation activity boosted the price of lumber to $873 per thousand board feet in December, up 173.1% from its April low. We expect the outlook for commodities to remain favourable as the global economy continues to recover through 2021.
Promising environment for value investments
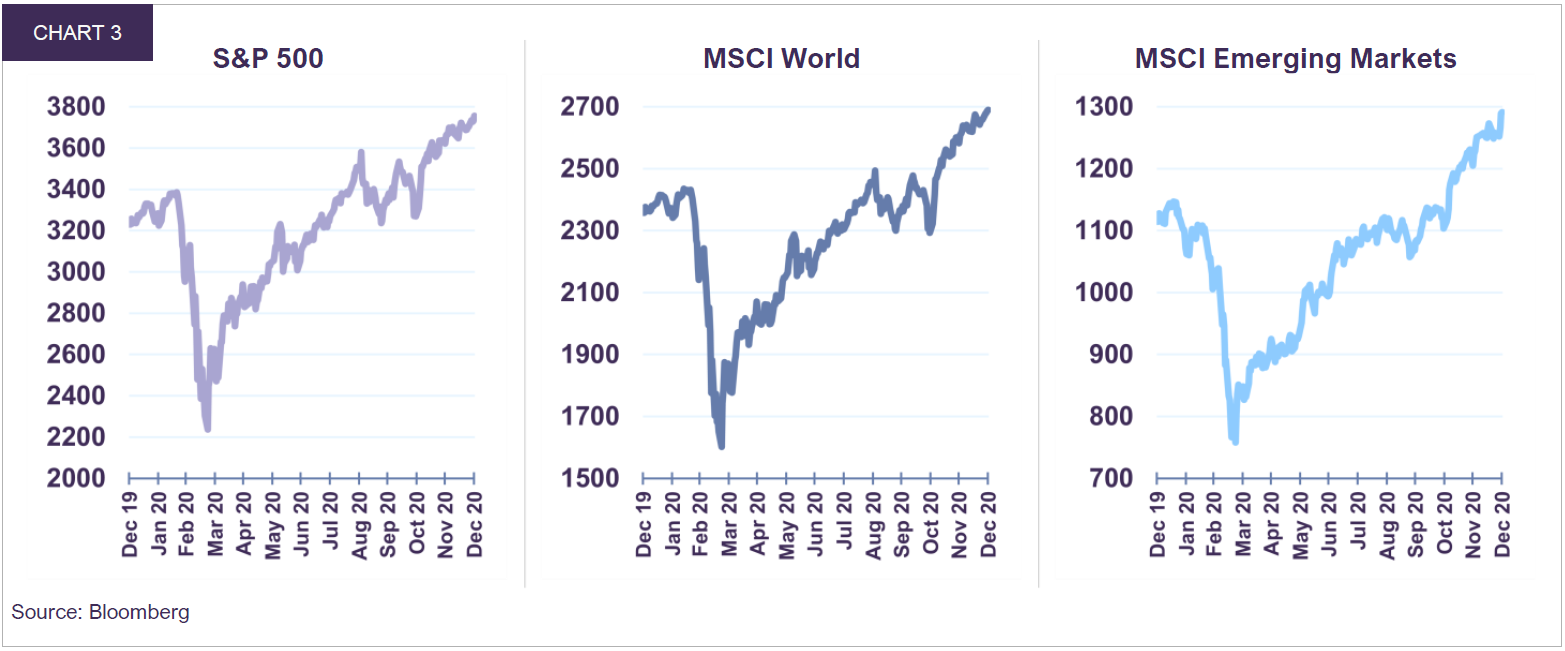
Global equity markets soared to new highs during Q4 on the emergence of several successful vaccines, continued monetary and fiscal support, and mounting evidence of a strong economic recovery. In Canadian dollar terms, the total return in Q4 for the S&P 500 was 7.0%, while the S&P/TSX (9.0%), DAX (8.1%), Nikkei (16.2%), MSCI World (8.7%) and MSCI EM (14.2%) all posted sizeable gains. Broad market indices ended the year at new highs, a noteworthy development given the sizable correction experienced during the first quarter (Chart 3).
During the early stages of the pandemic, large segments of the economy were in lockdown. Companies levered to the physical economy, such as commodities, industrials, financials and transportation (“low-multiple” value sectors), were the most affected while those tied to the digital service economy (“high-multiple” growth sectors) benefited. This disruption severely depressed the relative profitability of value companies versus growth companies, a significant factor in the underperformance of value. It also drove valuations to extremes: on a price-to-book basis, growth stocks are trading near record highs. This is in sharp contrast to value stocks, which barely deviated from their long-term averages (see The Illustrious History of Growth Through Value Investing – Webinar – Letko, Brosseau & Associates (lba.ca). Now, with a recovery underway and vaccine-related normalization around the corner, value investments have begun to bounce back. During the fourth quarter, the MSCI Value Index was up 10.4% in Canadian dollar terms vs. 8.7% for the MSCI World Index. In our assessment, we may be seeing the beginning of a rotation away from high-multiple growth stocks to low-multiple value stocks.
The large discrepancy in relative valuations across stock sectors is skewing the U.S. market’s valuation to the upside. While the 2021 P/E multiple for the S&P 500 is 23x, it is influenced by a minority of companies that trade at very high valuations. The median P/E multiple—measuring the valuation at the middle mark of the index and therefore less affected by outliers—is 21x. Meanwhile, the 2021 P/E for the S&P 500 Value Index is 18x, further indicating that certain areas of the market remain relatively inexpensive and could offer great opportunities in the future.
In this context, we believe that our portfolios are well-positioned to offer significant value creation in the medium-term. Overall, our global equity portfolio trades at a reasonable 14.4x times 2021 earnings, 1.2x price-to-book, and offers an attractive dividend yield of 3.1%.
While we are optimistic about the prospects for equities during this ongoing recovery, we believe bonds are likely to offer mediocre returns. A 30-year federal bond in Canada currently yields 1.25%. If rates were to stay low for a prolonged period, say 10 years, the cumulative total return for the bond over the next decade would be 13%. However, if at any time during the next 10 years interest rates were to rise by a mere 1%, bringing the level on par with expected inflation, the bond would incur a capital loss of 20%. We view this risk/return relationship as unattractive, especially considering that the average dividend yield on our portfolios is almost 2.5 times higher than long-term bond yields. We therefore continue to tilt our balanced portfolios towards equities and are maintaining a focus on capital preservation in the fixed income portion of balanced mandates.
Legal notes
All dollar references in the text are U.S. dollar unless otherwise indicated.
The information and opinions expressed herein are provided for informational purposes only, are subject to change and are not intended to provide, and should not be relied upon for, accounting, legal or tax advice or investment recommendations. Any companies mentioned herein are for illustrative purposes only and are not considered to be a recommendation to buy or sell. It should not be assumed that an investment in these companies was or would be profitable. Unless otherwise indicated, information included herein is presented as of the dates indicated. While the information presented herein is believed to be accurate at the time it is prepared, Letko, Brosseau & Associates Inc. cannot give any assurance that it is accurate, complete and current at all times.
Where the information contained in this presentation has been obtained or derived from third-party sources, the information is from sources believed to be reliable, but the firm has not independently verified such information. No representation or warranty is provided in relation to the accuracy, correctness, completeness or reliability of such information. Any opinions or estimates contained herein constitute our judgment as of this date and are subject to change without notice.
Past performance is not a guarantee of future returns. All investments pose the risk of loss and there is no guarantee that any of the benefits expressed herein will be achieved or realized.
The information provided herein does not constitute investment advice and it should not be relied on as such. It should not be considered a solicitation to buy or an offer to sell a security. It does not take into account any investor’s particular investment objectives, strategies, tax status or investment horizon. There is no representation or warranty as to the current accuracy of, nor liability for, decisions based on such information.
This presentation may contain certain forward-looking statements which reflect our current expectations or forecasts of future events concerning the economy, market changes and trends. Forward-looking statements are inherently subject to, among other things, risks, uncertainties and assumptions regarding currencies, economic growth, current and expected conditions, and other factors that are believed to be appropriate in the circumstances which could cause actual events, results, performance or prospects to differ materially from those expressed in, or implied by, these forward-looking statements. Readers are cautioned not to place undue reliance on these forward-looking statements.
The MSCI information may only be used for your internal use, may not be reproduced or redisseminated in any form and may not be used as a basis for or a component of any financial instruments or products or indices. None of the MSCI information is intended to constitute investment advice or a recommendation to make (or refrain from making) any kind of investment decision and may not be relied on as such. Historical data and analysis should not be taken as an indication or guarantee of any future performance analysis, forecast or prediction. The MSCI information is provided on an “as is” basis and the user of this information assumes the entire risk of any use made of this information. MSCI, each of its affiliates and each other person involved in or related to compiling, computing or creating any MSCI information (collectively, the “MSCI parties”) expressly disclaims all warranties (including, without limitation, any warranties of originality, accuracy, completeness, timeliness, non-infringement, merchantability and fitness for a particular purpose) with respect to this information. Without limiting any of the foregoing, in no event shall any MSCI Party have any liability for any direct, indirect, special, incidental, punitive, consequential (including, without limitation, lost profits) or any other damages. (www.msci.com).
Concerned about your portfolio?
Subscribe to Letko Brosseau’s newsletter and other publications: