 Canada - FR
 U.S. - EN
Economic and Capital Markets Outlook
April 2026
- The U.S./Israel-Iran war and the potential of a prolonged energy crisis have introduced material downside risk to the global outlook.
- The economic consequences of the conflict are highly uncertain, given the war’s duration and scope are unknown. Our base case is for world real GDP to advance by 3.0% in 2026 compared to 3.3% in 2025.
- U.S. growth was solid prior to the U.S./Israel-Iran war. Domestic oil production provides the economy with a degree of insulation from energy supply shocks. We anticipate U.S. real GDP growth will moderate to 1.0-2.0% this year.
- Higher energy prices could prove a boon to Canadian exports while fiscal and monetary policy present additional supports to the economy’s outlook. Our base case is for Canadian real GDP to advance between 1.0-2.0% in 2026.
- Notwithstanding potential energy risks, fiscal policy is expected to boost the Eurozone economy. We expect Eurozone real GDP growth in 2026 will settle in the 0-1.0% range.
- Prospects for China vary under different tariff and geopolitical scenarios. The IMF’s current forecast is for Chinese real GDP growth of 4.5% this year. In aggregate terms, emerging market activity is expected to remain broadly stable at 4.2% in 2026, per IMF estimates.
- Equity markets were volatile in the first quarter. In this environment, careful stock selection, price discipline and diversification remain paramount. We are comfortable holding a moderate cash level to allow us the flexibility to capitalize on market dislocations in a potentially turbulent period for equities.
Summary
The world economy has sustained a series of profound shocks in recent years, including the pandemic, the Russia/Ukraine war, high inflation and tariff hikes. With the onset of the U.S./Israel-Iran war, it appears that global resilience will once again be tested. The main economic risk from the conflict in the Middle East is a prolonged energy crisis. Given key variables are unknown, such as the ultimate duration and geographical reach of the fighting, the macro consequences remain challenging to predict.
Prior to the outbreak of the conflict, most indicators of activity signaled another year of near-trend growth. The J.P. Morgan Global Composite PMI Output Index, covering manufacturing and services in over 40 economies, expanded in February to a level consistent with 3% global real GDP growth. Meanwhile, the world economy is much less oil-dependent than it was during past energy shocks (Chart 1). Barring a sustained major disruption to energy flows, we do not expect current events to derail global growth.
Economic prospects must also be assessed on a regional basis given that spillovers from the U.S./Israel-Iran war differ by geography, as noted in our April Portfolio Update. Europe is facing a second energy shock in just four years, which will weigh on an already muted growth outlook. Other major economies which are reliant on energy imports, including China and India, are exposed to a similar risk, but hold inventories that could help bridge temporary supply disruptions. Elsewhere, the economies of the U.S. and Canada are well positioned to successfully navigate the current situation given energy self-sufficiency and momentum entering the crisis.
We have reviewed our economic forecast against this backdrop and, for now, we are only slightly revising our base case outlook. Our forecast is for global real GDP to advance by 3.0% in 2026. We are monitoring the situation closely and will incorporate new developments on the geopolitical front into our economic projections as warranted.
From an economic and financial markets perspective, negative swings in sentiment pose the biggest risk, as we have long cautioned. Historically high valuations and elevated consensus earnings expectations have remained at odds with the projected level of economic activity for some time now. The volatile performance of equities in the first quarter corroborates this view.
Periods such as these reinforce the importance of maintaining a disciplined risk management framework and principled investment approach. We continue to believe that the most suitable strategy for the current environment is an active approach that emphasizes price sensitivity, careful stock selection, both sectoral and regional diversification and a moderate cash reserve.
Oil Intensity Across Major Global Economies
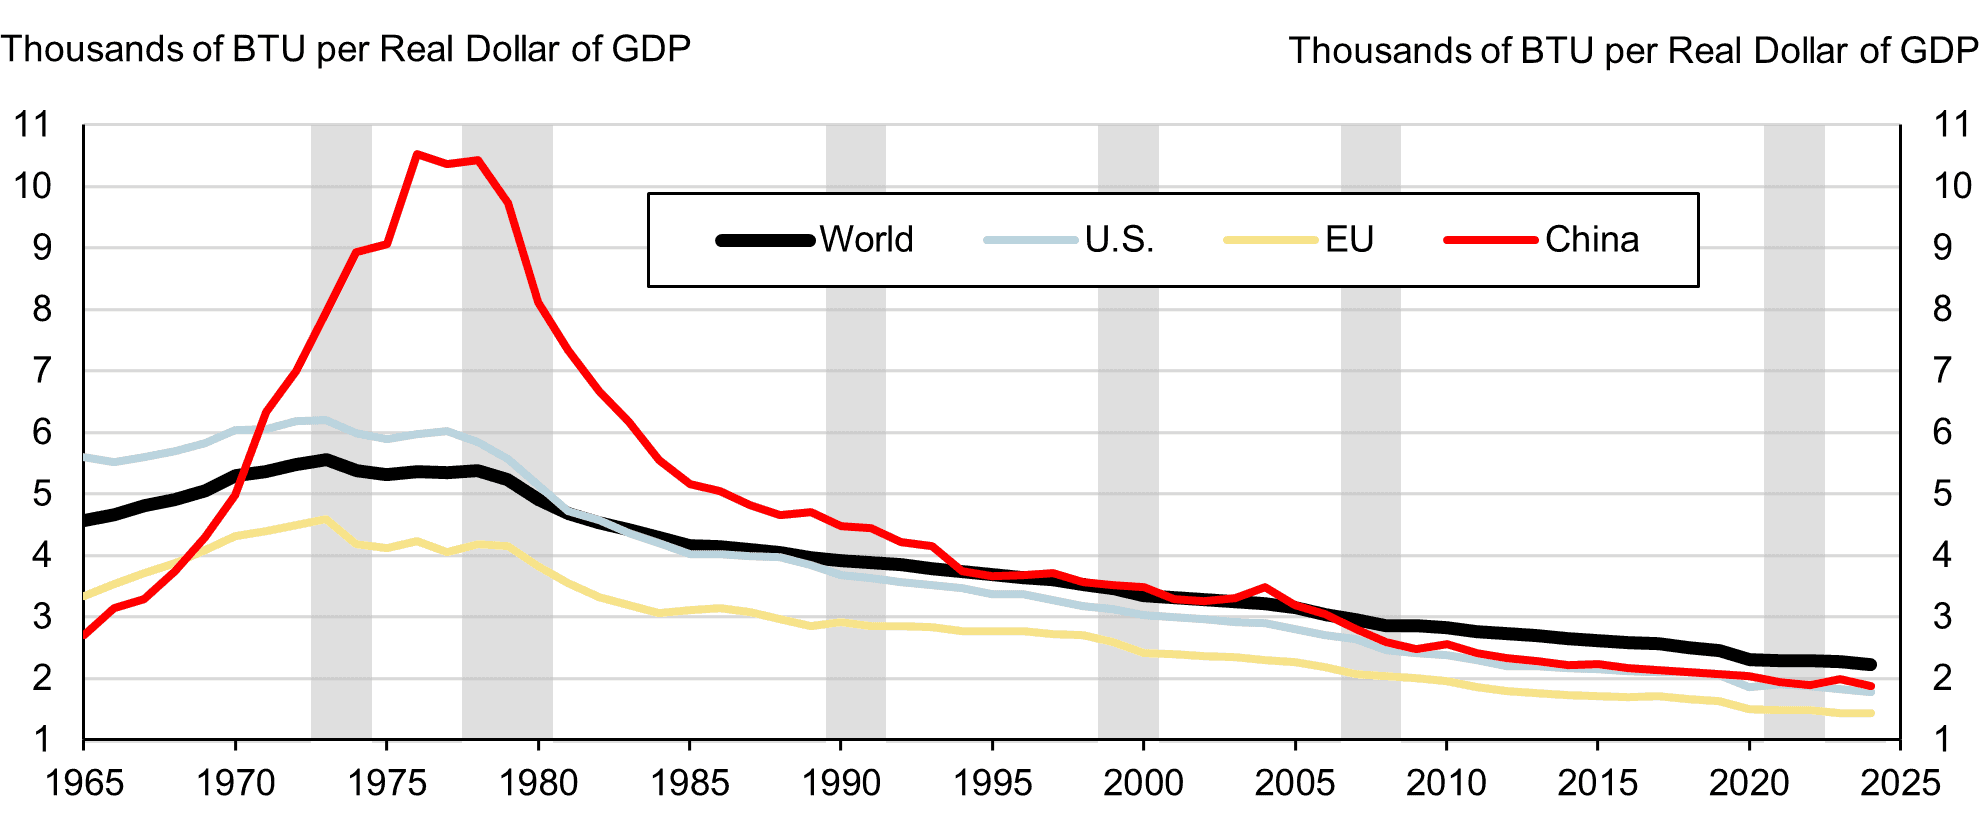
Note: Oil intensity is calculated using the Energy Institute's thermal conversion factor: 1 barrel of oil equivalent (boe) = 5.8 million BTU.
Shaded regions indicate major historical positive oil price shocks.
U.S. economy on solid footing before oil price shock
The U.S. economy has shown notable resilience amid a myriad of headwinds in recent months. While real GDP grew 0.2% quarter-on-quarter in Q4 2025– a material deceleration from 1.1% in Q3 – the data was distorted by the government shutdown. Government spending fell by 1.5% amid the six-week-long lockout, which subtracted nearly 1 full percentage point from annualized GDP growth. Meanwhile, underlying trends in private domestic demand remained firm as both consumer spending (+0.5%) and business investment (+0.6%) advanced. In real annual terms, the economy grew by 2.1% in 2025.
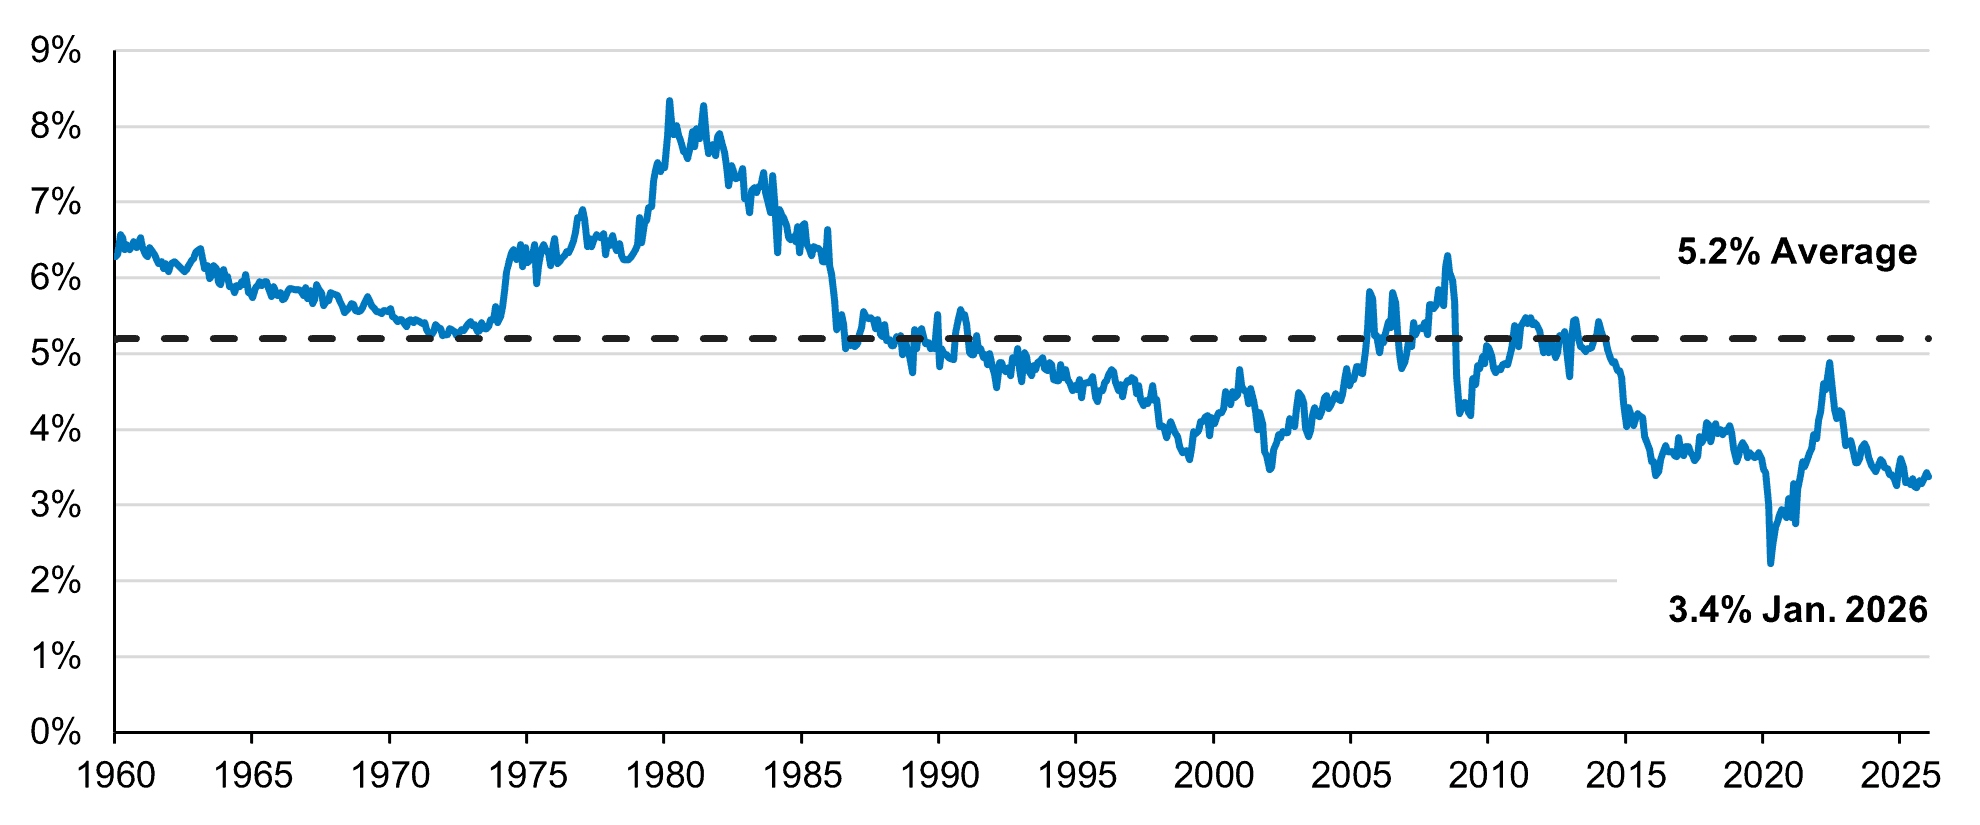
U.S. growth momentum was solid prior to the onset of the U.S./Israel-Iran war and domestic energy production provides the economy with a degree of insulation from energy supply shocks. Nonetheless, a spike in energy prices risks an inflation-induced drag on overall consumption. We note that the U.S. consumer has seen higher spending on energy relative to income in the past. Energy expenditure as a share of real income is currently well below its long-term average (Chart 2).
Absent a larger move in oil prices, we remain constructive on the outlook for consumer spending, the primary driver of U.S. growth. In our assessment, high income Americans are still well positioned to continue to make a positive contribution to overall consumer spending despite recent market volatility. Meanwhile, tax refunds related to the One Big Beautiful Bill Act should help shore up household finances for the middle class in the first half of 2026. We anticipate aggregate consumption will slow, but remain positive, in the coming months.
Outlooks vary for other categories of domestic demand. Business investment has held up well in the past several quarters, thanks in part to AI-related spending. However, capital spending could taper against a backdrop of elevated trade uncertainty and financial market volatility. On the fiscal side, the feasibility of tariff rebate cheques is now unclear following the Supreme Court’s ruling against broad-based country tariffs under the International Emergency Economic Powers Act (IEEPA). Similarly, the budget ramifications of potential tariff reimbursements and new temporary global tariffs obscure the potential contribution of fiscal policy to growth in 2026.
As for trade, tariffs have thus far failed to provide their purported boost to net exports. In real annual terms, modest export growth (+1.6%) was outpaced by imports (+2.7%), leading to a wider trade deficit (+5.6%) in 2025. We believe international trade will continue to have a negligible impact on growth over the course of this year.
Aggregating these factors within the broader context of geopolitical uncertainty, we conclude the U.S. is on track for slower growth, though we do not envision a recession. We forecast U.S. real GDP growth to moderate to between 1.0-2.0% in 2026.
U.S. energy spending as a share of personal disposable income (%)
Canada well-positioned for current challenges
Canadian real GDP contracted by 0.2% quarter-on-quarter in Q4 2025, but underlying dynamics were encouraging. Inventory accumulation gave way to withdrawals in the quarter, accounting for the main drag on growth. By contrast, household consumption rose 0.4% and robust government expenditures (+1.4%) continued to boost activity amid a ramp up in defence spending. Excluding inventories, real GDP advanced 0.8% in Q4. For the full year, despite facing trade-related challenges, real GDP grew by 1.7% in real terms.
Solid fundamentals suggest consumers will remain the primary driver of Canadian growth in the coming quarters. In the last six months, the economy added a cumulative 81,000 jobs and the unemployment rate declined from 7.1% to 6.7%. On the wage front, average hourly earnings rose 3.9% year-on-year in February, tracking ahead of inflation (1.8%).
While higher energy prices could weigh on consumer spending going forward, the personal savings rate stands at 4.4%, well above its pre-pandemic level of 2.8%, providing an offset to steeper transportation costs. Given the relative health of household balance sheets, higher gas prices are unlikely to compromise an overall constructive outlook for consumer spending.
We also note that higher oil and gas prices should be supportive of activity elsewhere in the Canadian economy. The energy sector accounts for around 10% of GDP and 21% of total exports. Stronger energy prices could prove a boon to a sizeable part of the economy and Canada’s international trade balance.
Aside from possible upside linked to Canada’s energy-exporter status, fiscal and monetary policy present additional supports to the outlook. The federal government’s 2025-26 budget deficit of C$78.3 billion (2.5% of GDP) implies a significant fiscal push going forward. Although the impact of higher oil prices on inflation may limit additional monetary easing, the Bank of Canada’s benchmark interest rate sits at a moderately stimulative 2.25%.
Trade and geopolitical uncertainty present hurdles to the Canadian economy, but we currently expect that activity will undergo an upswing this year. We forecast Canadian real GDP growth to improve to between 1.0-2.0% in 2026.
Outlook for stimulus and energy critical to Eurozone’s economy
Eurozone real GDP advanced 0.2% quarter-on-quarter in the last three months of 2025. On an annual basis, the economy grew 1.4%. Growth broadened across the region toward year end.
Spain continued to lead among major economies, recording a 0.8% quarter-on-quarter expansion in Q4. Germany’s economy grew 0.3% in the same period, driven by strong government spending on infrastructure and defence. Real GDP climbed 0.2% quarter-on-quarter in France, while output also rose in Italy (+0.3%).
The threat of a protracted conflict in the Middle East complicates what is otherwise a sanguine outlook for the Eurozone economy. The E.U. imports most of its energy needs: upwards of 85% of natural gas consumed is sourced externally, and more than 90% of oil consumed comes from abroad. Prolonged energy supply disruptions represent a far greater risk to activity in the region than energy price inflation. The European Central Bank (ECB) estimates that a 10% reduction in the supply of gas to the Eurozone could lower real economic output by 0.7%.
While the U.S./Israel-Iran war has introduced a material downside risk to the Eurozone’s outlook, the region’s economic prospects depend on both the evolution of the conflict and Europe’s capacity to adapt. As demonstrated during the natural gas crisis that followed Russia’s invasion of Ukraine, businesses, institutions and countries have dynamic responses to supply disruptions. In this prior episode, European nations mitigated energy shortfalls by drawing on strategic reserves, increasing imports from alternative sources and implementing energy rationing.
Notwithstanding potential energy risks, fiscal policy is expected to boost the Eurozone economy. Indeed, Germany’s fiscal deficit is forecast to rise by 1.5% of GDP, potentially adding 0.4-0.5 percentage points to aggregate Eurozone output in 2026. These factors lead us to believe a Eurozone recession is not a foregone conclusion. Pending further clarity on how the Middle East conflict evolves, we believe Eurozone real GDP growth will settle between 0-1.0% in 2026.
Growth moderating in China
China’s real GDP expanded 5.0% year-on-year in 2025. Economic indicators generally weakened towards year-end, but since then, more timely data suggests momentum is firming amid renewed stimulus efforts.
Retail sales rose 2.8% year-on-year through the first two months of 2026, a marked uptick from the 0.9% rate of growth observed in December. Industrial sector activity – a core pillar of growth last year – recorded a solid 6.3% increase in the same period. Elsewhere, investments in manufacturing (+3.1%) and infrastructure (+11.4%) rebounded from multi-month slides.
There are numerous indications that government policy will remain supportive. Per China’s National People’s Congress meeting in March, the central government’s budget deficit will remain at a record 4% of GDP. Meanwhile, the highly effective consumer trade-in subsidy scheme will now extend beyond providing incentives on purchases of vehicles, appliances and other consumer goods to include service sector subsidies.
While domestic conditions are stabilizing, external risks remain. Given last year’s record $1.2 trillion trade surplus, Chinese exports face a high bar to replicate their growth contribution in the year ahead. Meanwhile, trade frictions with the U.S. could reemerge, posing another challenge. Lastly, China’s strategic oil reserves may limit disruption to domestic activity for the time being, but prolonged shipping disruptions could pose a secondary risk to non-energy trade flows.
Though prospects vary under different tariff and geopolitical scenarios, the government recently announced a real GDP growth target of 4.5-5.0% in 2026, similar to the IMF’s forecast of 4.5%.
Divergent growth paths and risks in emerging markets
India outpaced every other major economy in 2025 as real GDP rose 7.5% year-on-year. Leading indicators from the start of this year suggest this trend will continue. In March, the HSBC Flash India Composite PMI remained well in expansionary territory at 56.5, despite rising energy costs. The IMF expects India’s economy to expand by 6.3% in 2026, underpinned by strong consumer demand and a pro-growth policy mix.
Mexico grew just 0.6% in real annual terms last year but activity is expected to improve in 2026. Financial conditions are supportive and, after a period of fiscal consolidation, the government’s economic stance should prove less of a headwind. Meanwhile, tariff exemptions for USMCA (CUSMA) compliant trade will continue to insulate Mexico from U.S. levies. The Mexican economy is projected to grow by 1.5% in 2026, per IMF estimates.
In Brazil, domestic demand has held up well thanks to record low unemployment and healthy real wage growth. While the unpredictability of an electoral campaign may weigh on consumer and business sentiment as the year progresses, the potential for monetary support is significant. Brazil’s benchmark interest rate of 14.75% is well above inflation (3.8%). With real rates among the highest worldwide, we believe Brazil is positioned for a substantial easing cycle. The IMF estimates real GDP growth will advance by 1.6% in 2026.
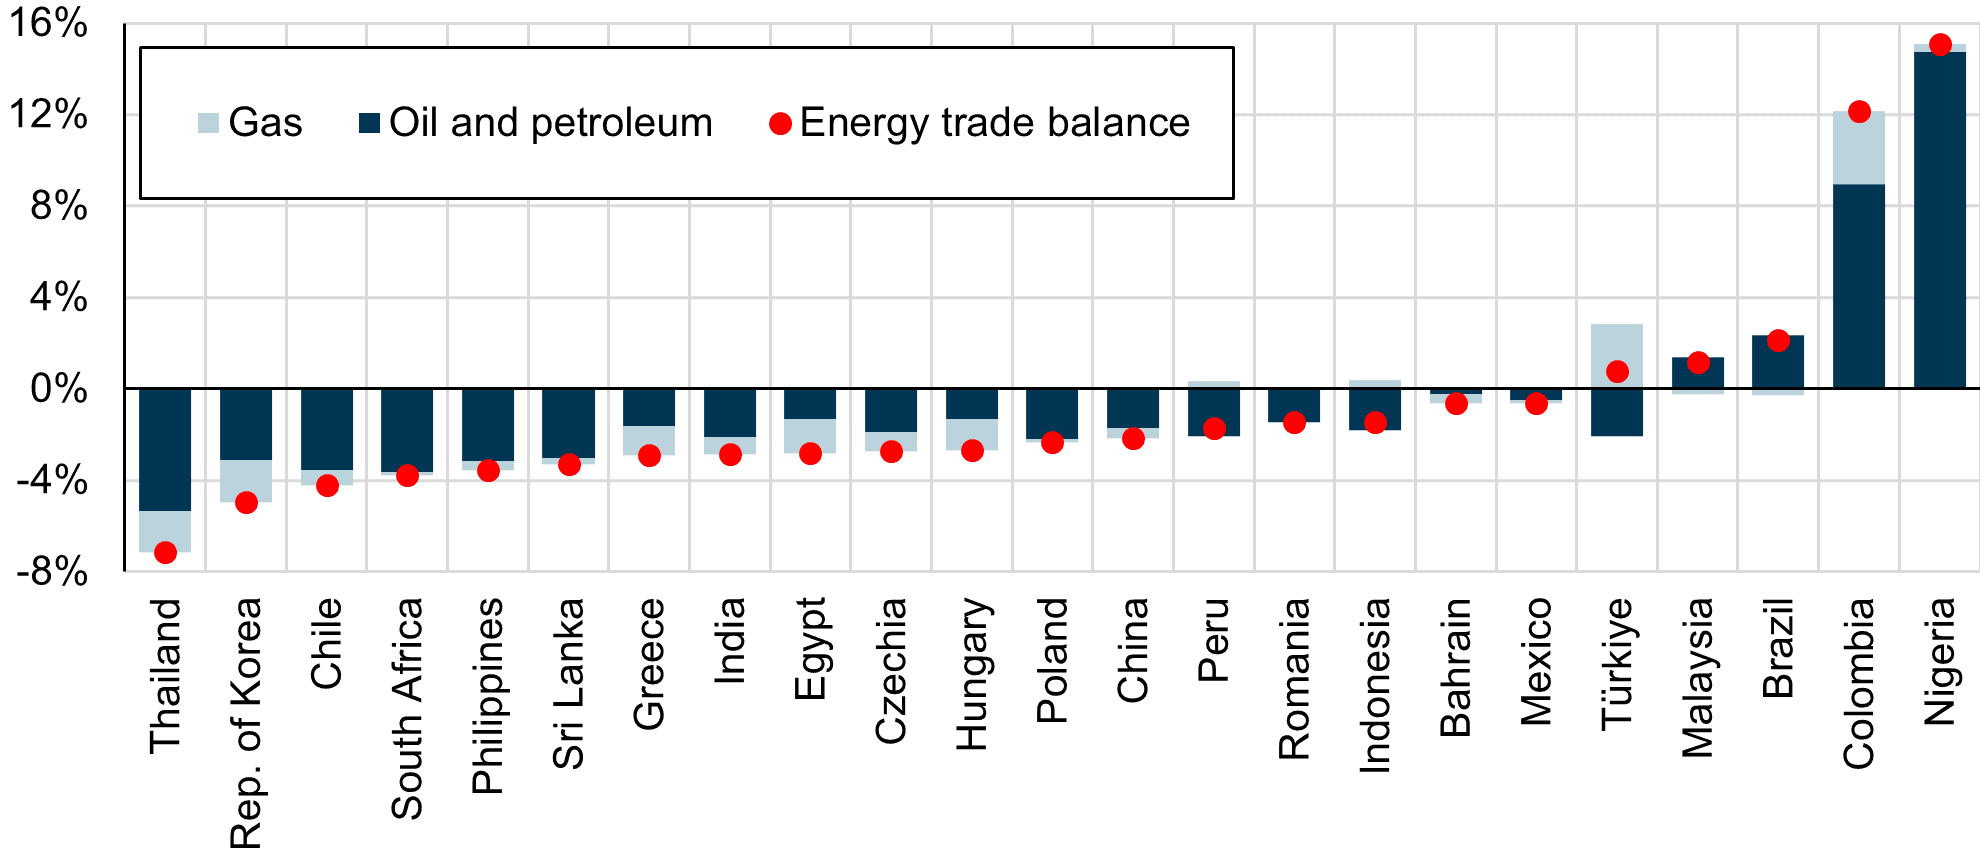
Outlooks vary on a country-by-country basis, and energy-price pressures are likely to reinforce divergences. Indeed, while energy exporters such as Brazil and Colombia stand to benefit from improved terms of trade, the reverse is true for importers like China and India (Chart 3). On balance, however, regional activity is expected to remain broadly stable. The IMF forecasts emerging market real GDP growth of 4.2% in 2026 compared to 4.4% in 2025.
Oil and Gas Trade Balance as a % of GDP
Market volatility rose throughout the first quarter
Global equities were volatile in the first quarter as the U.S./Israel-Iran war destabilized energy markets. The S&P 500 and MSCI World fell 2.6% and 2.1% respectively (total return in Canadian dollars), while the S&P/TSX (+3.9%) and MSCI Emerging Markets (+1.6%) were in positive territory during the quarter (Table 1). West Texas Intermediate (WTI) briefly touched $120 per barrel, before ending Q1 at $101. Oil prices were up by approximately 50% or around $34 per barrel since the start of the conflict. The risk of a sustained oil supply disruption is perceived to be rising, weighing on investor sentiment.
Over the past several quarters, we have repeatedly warned that some areas of the market were particularly exposed to a reversal in sentiment, regardless of the negative catalyst. In our assessment, lofty valuations and aggressive earnings estimates – particularly in the technology sector – have long appeared at odds with a subdued economic outlook. Even after the recent pullback, we reiterate our belief that a disconnect between economic fundamentals and investor expectations presents a significant risk still embedded in equity markets.
The S&P 500 trades at a forward P/E multiple of 17.5 times as at April 1st. Meanwhile, analyst estimates for S&P 500 earnings growth range from 15-17% for 2026. Given persistent geopolitical risks and trade-related uncertainty, we believe current valuations and earnings estimates may prove to be optimistic.
Periods such as these highlight the importance of maintaining a steadfast commitment to long-term objectives, price discipline, rigorous fundamental analysis, and diversification. Consistent with this approach, we have retained a moderate level of cash in our portfolios and continue to exercise patience in the redeployment of capital. Besides allowing us the flexibility to capitalize on market dislocations in a potentially tumultuous period for equities, short-term instruments also provide positive real yields between 0.5%-0.8% in Canadian dollar terms and around 1.3% in U.S. dollars in the interim.
On balance, we believe our global strategy remains well valued at 13.5 times 2026 earnings, despite having seen double-digit returns in the past year. The portfolio continues to trade at a discount to the MSCI ACWI (17.5x P/E) and possesses a strong medium- to long-term earnings growth potential regardless of near-term challenges.
Turning to fixed income, our strategy is unchanged. We continue to focus on capital preservation and are minimizing risks in our bond holdings by prioritizing credit quality and avoiding long duration securities. We believe long-term bonds remain acutely vulnerable to inflationary risks tied to energy price pressures. At this stage, we do not advocate any major changes in asset allocation over and above what we have already done.
Global Stock Markets and Select Company Returns
| Recent Peak* |
Q1 2026 Close |
Change from Peak |
Q1 total return** |
|
| S&P 500 | 6,979 | 6,529 | -6.4% | -2.6% |
| Nasdaq | 23,958 | 21,591 | -9.9% | -4.3% |
| Nvidia | 207 | 174 | -15.8% | -5.0% |
| Microsoft | 542 | 370 | -31.7% | -22.3% |
| Amazon | 254 | 208 | -18.0% | -8.4% |
| S&P TSX | 34,541 | 32,768 | -5.1% | 3.9% |
| MSCI World | 4,578 | 4,258 | -7.0% | -2.1% |
| MSCI EM | 1,619 | 1,397 | -13.7% | 1.6% |
| Europe (BBG) | 212 | 195 | -8.0% | -1.1% |
| Nikkei | 58,850 | 51,064 | -13.2% | 2.3% |
The information and opinions expressed herein are provided for informational purposes only, are subject to change and are not intended to provide, and should not be relied upon for, accounting, legal or tax advice or investment recommendations. Any companies mentioned herein are for illustrative purposes only and are not considered to be a recommendation to buy or sell. It should not be assumed that an investment in these companies was or would be profitable. Unless otherwise indicated, information included herein is presented as of the dates indicated. While the information presented herein is believed to be accurate at the time it is prepared, Letko, Brosseau & Associates Inc. cannot give any assurance that it is accurate, complete and current at all times.
Where the information contained in this presentation has been obtained or derived from third-party sources, the information is either from recognized financial and statistical reporting services or similar sources believed to be reliable, but the firm has not independently verified such information. No representation or warranty is provided in relation to the accuracy, correctness, completeness or reliability of such information. Any opinions or estimates contained herein constitute our judgment as of this date and are subject to change without notice.
Past performance is not a guarantee of future returns. All investments pose the risk of loss and there is no guarantee that any of the benefits expressed herein will be achieved or realized.
The information provided herein does not constitute investment advice and it should not be relied on as such. It should not be considered a solicitation to buy or an offer to sell a security. It does not take into account any investor’s particular investment objectives, strategies, tax status or investment horizon. There is no representation or warranty as to the current accuracy of, nor liability for, decisions based on such information.
Certain information contained in this document constitutes “forward-looking statements,” which can be identified by the use of forward-looking terminology such as “may,” “will,” “should,” “expect,” “anticipate,” “target,” “project,” “estimate,” “intend,” “continue” or “believe,” or the negatives thereof or other variations thereon or comparable terminology. Forward-looking statements are inherently subject to, among other things, risks, uncertainties and assumptions regarding currencies, economic growth, current and expected conditions, and other factors that are believed to be appropriate in the circumstances which could cause actual events, results, performance or prospects to differ materially from those expressed in, or implied by, these forward-looking statements. Readers are cautioned not to place undue reliance on these forward-looking statements.
The MSCI information may only be used for your internal use, may not be reproduced or redisseminated in any form and may not be used as a basis for or a component of any financial instruments or products or indices. None of the MSCI information is intended to constitute investment advice or a recommendation to make (or refrain from making) any kind of investment decision and may not be relied on as such. Historical data and analysis should not be taken as an indication or guarantee of any future performance analysis, forecast or prediction. The MSCI information is provided on an “as is” basis and the user of this information assumes the entire risk of any use made of this information. MSCI, each of its affiliates and each other person involved in or related to compiling, computing or creating any MSCI information (collectively, the “MSCI parties”) expressly disclaims all warranties (including, without limitation, any warranties of originality, accuracy, completeness, timeliness, non-infringement, merchantability and fitness for a particular purpose) with respect to this information. Without limiting any of the foregoing, in no event shall any MSCI Party have any liability for any direct, indirect, special, incidental, punitive, consequential (including, without limitation, lost profits) or any other damages. (www.msci.com).
The S&P/TSX Index is a product of S&P Dow Jones Indices LLC or its affiliates (“SPDJI”) and TSX Inc., and has been licensed for use by Letko, Brosseau & Associates Inc. Standard & Poor’s® and S&P® are registered trademarks of Standard & Poor’s Financial Services LLC (“S&P”); Dow Jones® is a registered trademark of Dow Jones Trademark Holdings LLC (“Dow Jones”); and these trademarks have been licensed for use by SPDJI and sublicensed for certain purposes by Letko, Brosseau & Associates Inc. TSX® is a registered trademark of TSX Inc., and have been licensed for use by SPDJI and Letko, Brosseau & Associates Inc. Letko, Brosseau & Associates Inc.’s product is not sponsored, endorsed, sold or promoted by SPDJI, Dow Jones, S&P, their respective affiliates, or Bloomberg and none of such parties make any representation regarding the advisability of investing in such product(s) nor do they have any liability for any errors, omissions, or interruptions of the S&P/TSX Index.
Bloomberg Finance L.P. Used with permission of Bloomberg Finance L.P.
J.P. Morgan Global Composite PMI® and HSBC Flash India PMI® data are compiled by S&P Global. PMI and Purchasing Managers’ Index are trademarks of S&P Global. All rights reserved.
Concerned about your portfolio?
Subscribe to Letko Brosseau’s newsletter and other publications: