 Canada - FR
 U.S. - EN
- Lingering uncertainty over tariffs is expected to temper economic activity in the second half of the year. Our base case is for global real GDP to advance by 3.0% in 2025 compared to 3.3% in 2024.
- A weaker labour market will weigh on private spending in the U.S., while public spending should remain robust. Consequently, we forecast U.S. real GDP growth to moderate to 1.0-2.0% in 2025.
- An accommodative mix of monetary and fiscal policy will help support the Canadian economy. Our forecast is for Canadian real GDP to advance between 0.5-1.5% in 2025.
- The Eurozone’s growth prospects depend on tariff de-escalation and the extent of further policy support. We anticipate Eurozone real GDP growth of 0.5-1.5% in 2025.
- The Chinese economy recorded a strong start to the year thanks to a front-loading of exports and production as well as earlier stimulus efforts. The IMF forecasts real GDP growth of 4% for China in 2025.
- Outlooks vary across emerging economies but, on balance, activity in the region is forecast to decelerate. The IMF expects emerging market real GDP growth to slide from 4.3% in 2024 to 3.7% in 2025.
- Stock markets are pricing in lofty forecasts for profit growth, at odds with subdued economic fundamentals. We maintain that the most suitable strategy for the current environment is an active approach that emphasizes price sensitivity, careful stock selection, and a moderate cash reserve.
Summary
Breakthroughs in trade talks between the U.S. and its major trading partners buoyed financial markets in the second quarter. Global equities recovered their post- “Liberation Day” losses and rallied higher toward record levels last seen in February. However, in our view, investors’ current optimism is somewhat overdone.
Early this year—before excitement over the Trump administration’s pro-business agenda gave way to trade policy fears—we warned that equity markets appeared disconnected from the projected moderate level of economic activity. It was, therefore, unsurprising that stocks experienced a sharp pullback between February and April as a tariff war took hold and investors were compelled to reevaluate their expectations. Now, however, broad indices are again pricing in lofty assumptions. In our assessment, consensus forecasts for robust company earnings and expensive market multiples remain inconsistent with an economy positioned for weaker growth.
Tariff rates between the world’s two largest economies, the U.S. and China, have receded from prohibitive triple-digit territory but are still elevated. Meanwhile, broad swathes of U.S. imports from other trading partners face blanket charges of up to 50%. Absent a major tariff rollback, trade friction will continue to weigh on demand, investment, and confidence in the second half of the year. We forecast global real GDP growth will slow to 3.0% in 2025 from 3.3% in 2024.
Our investment stance is consistent with our overarching message of the past several months: the primary risk from both an economic and market perspective is that negative sentiment takes hold. With a moderate cash position in our portfolios, we are maintaining a degree of flexibility in the event of market dislocations. Our strategy positions us to navigate a potentially more volatile period for equities.
U.S. on course for slower growth
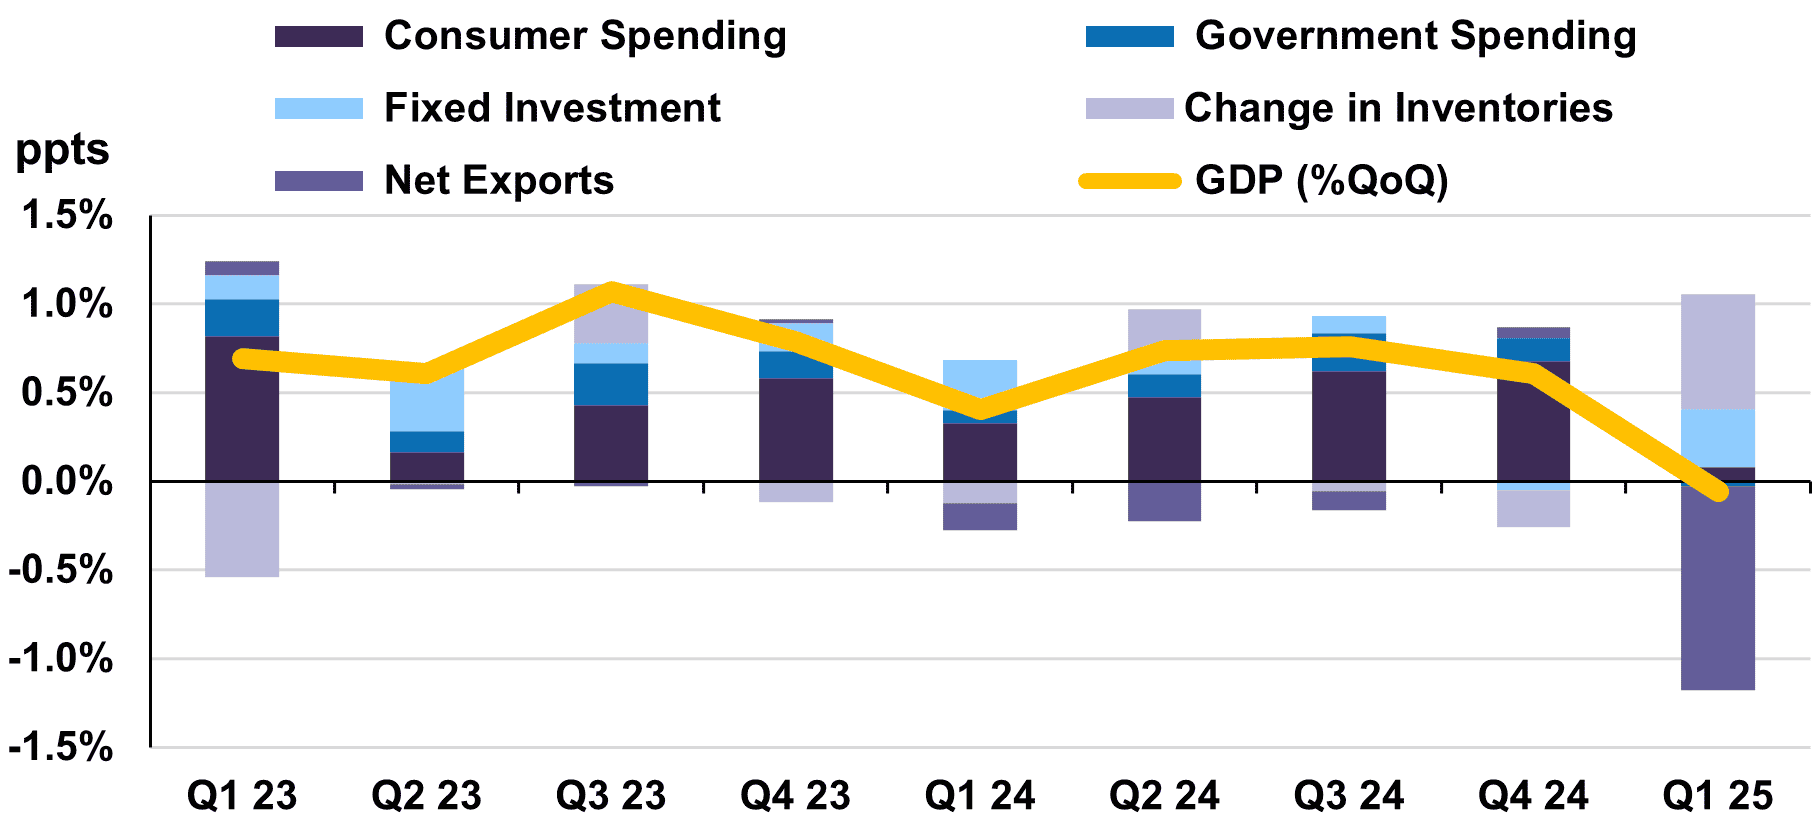
The U.S. economy has shown notable resilience to date. While real GDP fell 0.1% quarter-on-quarter in Q1, the data was distorted by pre-tariff front-loading (Chart 1). Imports surged 8.4% quarter-on-quarter in anticipation of tariff announcements, offsetting a healthy 0.4% expansion in final domestic demand (GDP less trade and inventories). In annual terms, real aggregate output rose 2.0% against a year ago.
Looking ahead, conditions are in place for household spending – the key engine of domestic activity – to gradually soften. Job gains have moderated from 209,000 positions per month in Q4 2024 to 124,000 per month between January-May 2025, a sign that labour demand is waning.
While hiring may weaken further as higher input prices from tariffs begin to factor into headcount decisions, the U.S. jobs market is on solid footing heading into the second half of 2025. Indeed, the unemployment rate has remained stable at around 4% for the past year, highlighting a reluctance to lay off workers despite economic uncertainties.
Real wage growth and a positive net worth effect following the equity market rebound provide additional support to the outlook for consumption. Average hourly earnings increased by 3.9% in May, tracking ahead of inflation (2.4%). Household net worth stood at $160 trillion in Q1, and likely climbed higher in Q2, especially for upper-income Americans more exposed to equity markets. As a result, we believe consumer spending will remain in positive territory in the coming months.
Prospects are mixed across other categories of domestic demand. Efforts by many firms to build inventories and purchase trade-exposed capital equipment ahead of tariffs could weigh on growth in subsequent quarters, given these actions amount to a front-loading of expenditures. Meanwhile, the lingering threat of steeper tariffs underscores the risk that uncertainty alone will curtail investment decisions in the interim.
On the fiscal side, the budget framework recently passed by Congress signals that the U.S. is moving toward even looser policy. According to the independent Committee for a Responsible Federal Budget, the Trump administration’s budget bill would add nearly $600 billon of deficit spending to the current baseline, raising the annual fiscal deficit to $2.3 trillion or 6.9% of GDP by 2027. Government spending will continue to add to growth in the near term.
Notwithstanding the potential negative effects of rising treasury borrowing requirements on the U.S. economy – which we judge to be more of a medium- to long-run risk – we anticipate a gradual deceleration in economic activity over the remainder of the year. We forecast U.S. real GDP growth in the 1.0-2.0% range in 2025.
Contributions to U.S. Real GDP Growth by Sector
Canadian economy resilient but cooling
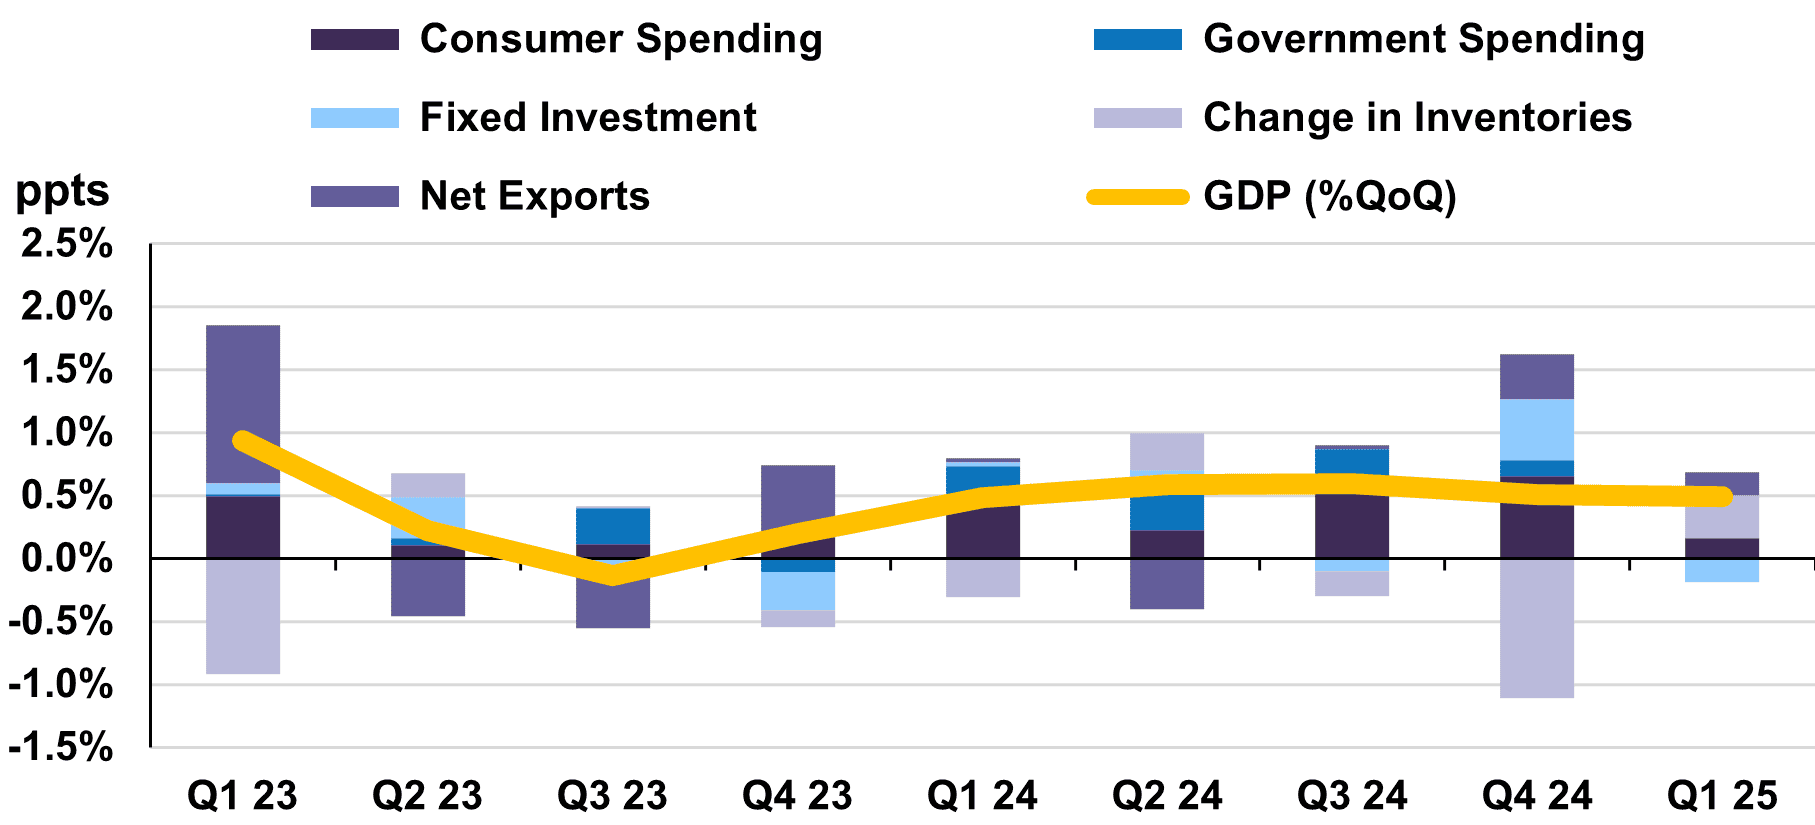
In Canada, real GDP rose 0.5% quarter-on-quarter in Q1. Robust export growth (+1.6%) and inventory accumulation, both consequences of looming U.S. tariffs, masked otherwise weak domestic conditions (Chart 2). Indeed, final domestic demand stalled in Q1 as contractions in business investment (-0.8%) and government expenditures (-0.2%) offset muted household spending (+0.3%). In real annual terms, the economy grew 2.3% year-on-year in Q1, a rate of expansion unlikely to be sustained given weaker underlying momentum.
In May, the unemployment rate reached a cycle-high of 7.0%. Somewhat encouragingly, robust labour force growth, rather than job losses, remains the primary driver of higher unemployment to date. Over the past twelve months, the economy generated 280,000 jobs, lagging well behind labour force growth of 471,000 people. Slack is increasing in Canada’s job market and is unlikely to be absorbed in the coming months given subdued hiring demand. Meanwhile, income gains have cooled alongside labour market conditions. Average hourly wage growth decelerated to 3.4% year-on-year in May compared to 4.9% at the end of 2024.
We note the combination of poor job prospects for new labour market entrants and softer wage growth will weigh on aggregate consumer spending going forward. However, Canadian households possess an important offset to navigate these headwinds. The personal savings rate stands at 5.7%, well above its pre-pandemic level of 2.8%, a sign of the relative health of household balance sheets. On balance, the outlook for consumption remains moderately constructive.
While we expect a slower rate of growth for the Canadian economy in the next several quarters, continued risks surrounding trade policy threaten a worse outcome. The unpredictability of trade negotiations will continue to weigh on consumer and business sentiment, while broad-based U.S. tariffs, if maintained, imply a major growth shock.
There are several ways Canada can mitigate trade disruption, and we do not believe a tariff-induced recession is in the cards. The benchmark interest rate stands at 2.75%, well above its pre-pandemic level of 1.75%. This affords the Bank of Canada room to provide more monetary easing on top of the 225 basis points of rate cuts that have already been delivered since mid-2024. There is also ample space to provide support on the fiscal front. As previously highlighted, Canada’s fiscal deficit stands at 2% of GDP (including both federal and provincial government budget balances), one of the lowest among G7 nations. If Canada increased spending such that its budget deficit rose to 4.6%, the average level prevailing among the G7, the economic hit of U.S. tariffs would largely be mitigated.
We expect activity in Canada will remain soft, but an accommodative mix of monetary and fiscal policy will help support growth. Our forecast is for Canadian real GDP to advance between 0.5-1.5% in 2025.
Contributions to Canada's Real GDP Growth by Sector
Stimulus key to reviving Eurozone outlook
Eurozone real GDP grew 0.6% quarter-on-quarter in the first three months of 2025, up from 0.3% at year-end. On an annual basis, the economy advanced 1.5%. Country-level GDP data showed broadly stable activity in Q1. Among major economies, real GDP advanced 0.4% quarter-on-quarter in Germany, while output also rose in France (+0.1%). Growth in Spain was robust (+0.6% quarter-on-quarter) on the back of strong external demand. Elsewhere, Italy recorded a 0.3% expansion in the same period, its highest rate of quarterly growth in a year.
After an encouraging first quarter, economic activity appears to have slowed. In June, the HCOB Eurozone Composite PMI remained unchanged from the previous month at 50.2, marking a sixth straight month of rising business activity but only marginally above the expansion threshold (50). While manufacturing output modestly increased, prospects elsewhere in the economy are challenging. The HCOB Services PMI subcomponent – a more domestically-focused activity measure – pointed to stagnating service sector activity in the same period.
U.S. tariffs risk becoming more of a headwind to Eurozone growth going forward. On the positive side, easier financial conditions should help stabilize domestic activity. The ECB lowered its benchmark interest rate by 25 basis points to 2.0% in June, its eighth interest rate cut in the past year. Meanwhile, Germany’s €500 billion infrastructure investment plan and higher regional defense spending should provide additional tailwinds to activity later this year and into 2026.
The Eurozone’s near-term economic trajectory depends on both the evolution of U.S. trade policies and the actions to be taken by fiscal and monetary policymakers at home. We anticipate Eurozone real GDP will advance between 0.5-1.5% this year.
China unlikely to sustain its robust first quarter performance
The Chinese economy recorded a strong start to the year. Real GDP rose 5.4% in annual terms in Q1. Industrial output (+5.9% year-on-year) led growth in the quarter, while service sector activity (+5.3%) also performed well. Since then, a sharp deterioration in the trade environment threatens to reverse the recent rebound in activity.
China’s exports to the U.S. plunged 34.5% year-on-year in May against a backdrop of prohibitive tariff rates. While trade negotiations in May saw the U.S. lower its additional levies on China from 145% to 30%, the overall tariffs of over 50% are still high enough to hurt Chinese exporters. Given the high level of integration between China’s trade sector and its industrial complex, U.S. tariffs are likely to leave an imprint on manufacturing output as well. Indeed, industrial production increased 5.8% year-on-year in May, extending its retreat from March’s multi-year high of 7.7%.
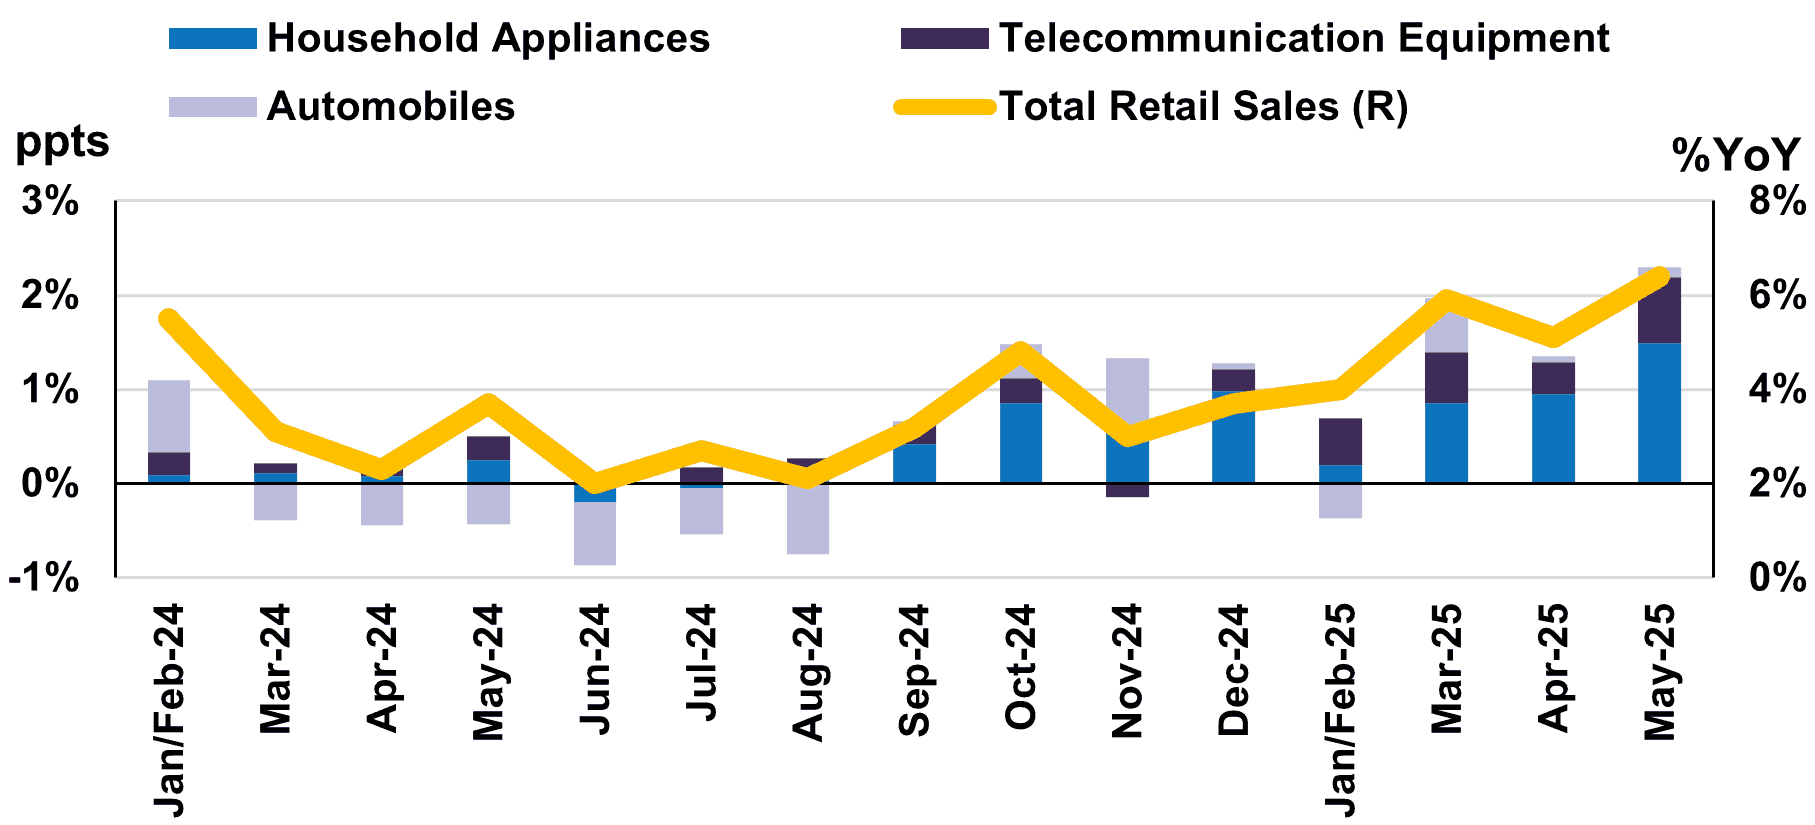
Elsewhere, the picture is mixed. May retail sales grew a healthy 6.4% in annual terms. Strong spending on electronics (+33.0%) and household appliances (+53.0%) highlighted the effectiveness of the government’s 300-billion-yuan consumer subsidy scheme (Chart 3).
In contrast, policy support measures have yet to engineer a turnaround in China’s property market. Real estate investment sank 10.7% year-on-year in May, extending a period of contraction dating back several years. Nonetheless, the economy possesses important counterweights to the struggling property sector. In May, total fixed asset investment grew by 3.7% year-on-year as positive contributions from investments in infrastructure (+5.6%) and manufacturing (+8.5%) more than offset the drag from housing.
Signs that stimulus efforts, namely the consumer subsidy scheme, are having a positive effect on demand are encouraging. However, tariff spillover risks and prolonged weakness in the real estate sector make a strong case for additional support measures. The PBOC’s recent release of one trillion yuan (0.8% of GDP) of liquidity into the banking system confirms that policymakers remain committed to stabilizing China’s economy.
Despite Beijing’s resolve to meet its 5% growth target, the economy’s current challenges are significant. The IMF forecasts China’s real GDP growth will moderate to 4% in 2025.
Contribution from Trade-in Goods to Retail Sales Growth
Outlooks vary across emerging markets
In India, real GDP rose 7.4% in Q1 versus the prior year, an improvement from growth of 6.4% in the fourth quarter. Household spending, up 6% year-on-year, fared well on the back of lower food and energy inflation. Meanwhile, investment surged 9.4% in the same period as lower borrowing costs filtered into real activity. India is well positioned to maintain a rapid rate of growth through year end.
Domestic demand should continue to receive a boost from easier financial conditions. In May, the Reserve Bank of India lowered its benchmark interest rate by 50 basis points and has now delivered a full percentage point of rate cuts over three consecutive meetings. On the external front, India faces relatively low tariff barriers from the U.S. and has a minor dependence on U.S. trade – goods exports to the U.S. are just 2.3% of GDP. The Indian economy is projected to grow by 6.2% in real annual terms in 2025, per IMF estimates.
The Mexican economy grew just 0.8% in real annual terms in the first quarter. While consumer and employment trends are relatively constructive, a marked deterioration in external conditions looms over Mexico’s near-term prospects. Given Mexico sends over 80% of its exports to the U.S., it is particularly vulnerable to tariffs. Indeed, the IMF recently downgraded its forecast for Mexico citing the impact of tariffs and now anticipates real GDP will contract 0.3% in 2025.
Brazil saw robust growth in Q1 as real GDP expanded 2.9% against a year ago. Despite higher interest rates, household spending and private investment remained strong. While more recent indicators continue to show a healthy level of activity, restrictive monetary policy is expected to weigh on the economy in the second half of the year. The IMF projects real GDP growth for Brazil will moderate to 2.0% in 2025.
Slowdowns are anticipated in the largest emerging market economies and after a period of steady performance at the regional level, aggregate growth is projected to decelerate. The IMF anticipates emerging market real GDP growth to slide from 4.3% in 2024 to 3.7% in 2025.
Markets buoyed by trade war de-escalation
Global equity markets rallied in the second quarter, overcoming tariff concerns and anxieties around U.S. deficit spending. The year-to-date total return of the S&P 500 was 0.8% (in Canadian dollar terms), while the S&P/TSX (10.2%), MSCI ACWI (4.4%), and MSCI Emerging Markets (9.4%) all closed the first half of the year in positive territory.
The agreement reached between the U.S. and China in May to mutually reduce tariffs marked a sharp reversal from the tit-for-tat escalation that followed in the wake of U.S. reciprocal tariff announcements on April 2nd. The deal has bolstered hopes that trade tensions will continue to de-escalate. The S&P 500 rose more than 9% since the U.S.-China trade détente was reached and is nearing a return to record territory.
Though recent events are encouraging, the outlook for trade policy is still highly uncertain. Even after the latest reductions, tariffs imposed by the U.S. remain historically high. Barring a flurry of trade agreements or another U.S. deferral, reciprocal tariffs are scheduled to increase in early August. Meanwhile, recent agreements also feature expiry dates, which suggests higher tariffs could be reintroduced if negotiations reach an impasse. We believe it is premature to conclude that these developments signal the beginning of a sustained tariff de-escalation; case in point is the doubling of U.S. duties on steel and aluminum imports in June.
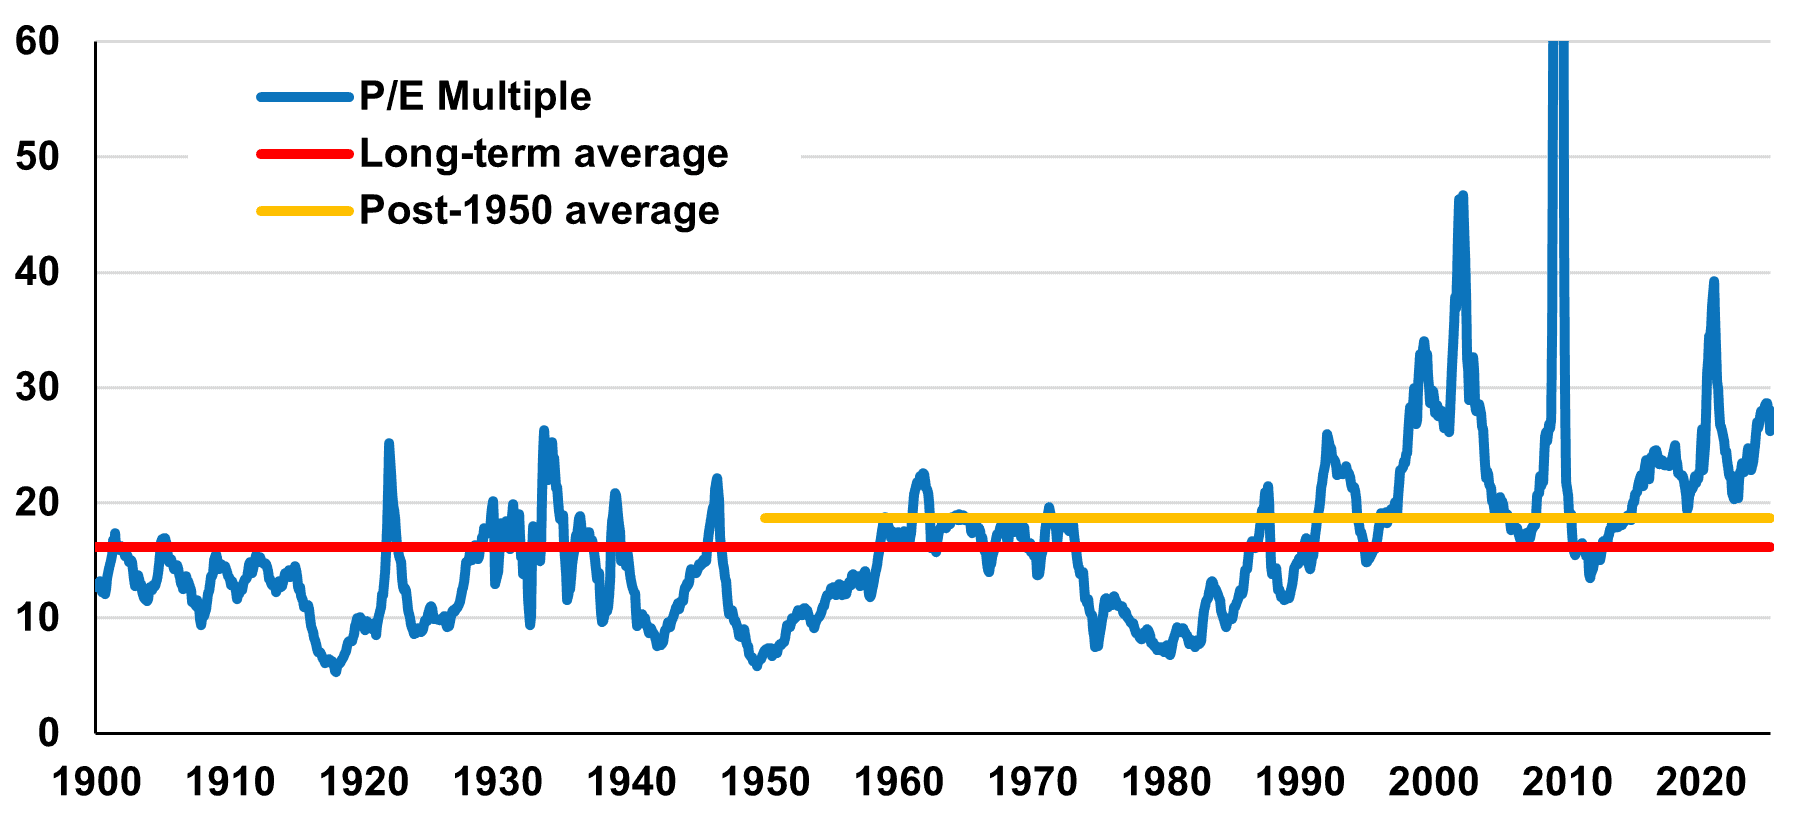
The S&P 500 currently trades at a P/E multiple of 26.2 (based on trailing earnings), a premium of more than 60% to its long-term average (Chart 4). Meanwhile, consensus S&P 500 forecasts are for earnings growth of 9.4% year-on-year in 2025. Considering that decelerating economic activity and tariff costs are likely to affect firms’ profitability, current valuations and earnings estimates may prove to be overly optimistic. In our opinion, the ongoing disconnect between economic fundamentals and market expectations necessitates a degree of caution from investors.
Policy developments have led to dramatic swings in sentiment to date, highlighting a significant behavioral risk embedded in equity markets. Periods such as these reinforce the importance of maintaining a disciplined risk management framework and steadfast commitment to long-term objectives. Consistent with this approach, we have taken the opportunity to realize gains on several holdings that achieved or exceeded our valuation and return targets in recent months.
Meanwhile, we are exercising price sensitivity in redeploying capital. Our equity strategies hold a moderate level of cash at this juncture, while our balanced portfolios remain close to our equity target. On balance, we believe our equity investments continue to provide attractive growth prospects over a 3-5-year horizon. The LetkoBrosseau Global Equity and Emerging Markets Equity strategies trade at substantial discounts to their benchmarks and offer compelling value at 12.6x and 10.9x estimated 2025 earnings respectively.
In fixed income, our strategy is unchanged. We continue to avoid longer-dated bonds, and the average duration of our portfolios is around 4 years, notably below the benchmark’s duration of 7.1 years. At 3.6%, the 30-year Canadian federal bond yield remains well under our fair value estimate of about 4.5%, based on our long-term assumption of real GDP growth (2%) and inflation (2.5%). This suggests longer-duration Canadian bonds are still expensive and likely to destroy purchasing power over time. Furthermore, the potential inflationary effect of tariffs further detracts from the risk/reward profile of long-term bonds at this stage.
While we remain mindful of near-term volatility, we do not advocate for any material shifts in asset allocation. We believe our measured approach will be rewarded in the medium term, and we remain optimistic about the return opportunities in our portfolios.
S&P 500 P/E Multiple
The information and opinions expressed herein are provided for informational purposes only, are subject to change and are not intended to provide, and should not be relied upon for, accounting, legal or tax advice or investment recommendations. Any companies mentioned herein are for illustrative purposes only and are not considered to be a recommendation to buy or sell. It should not be assumed that an investment in these companies was or would be profitable. Unless otherwise indicated, information included herein is presented as of the dates indicated. While the information presented herein is believed to be accurate at the time it is prepared, Letko, Brosseau & Associates Inc. cannot give any assurance that it is accurate, complete and current at all times.
Where the information contained in this presentation has been obtained or derived from third-party sources, the information is from sources believed to be reliable, but the firm has not independently verified such information. No representation or warranty is provided in relation to the accuracy, correctness, completeness or reliability of such information. Any opinions or estimates contained herein constitute our judgment as of this date and are subject to change without notice.
Past performance is not a guarantee of future returns. All investments pose the risk of loss and there is no guarantee that any of the benefits expressed herein will be achieved or realized.
The information provided herein does not constitute investment advice and it should not be relied on as such. It should not be considered a solicitation to buy or an offer to sell a security. It does not take into account any investor’s particular investment objectives, strategies, tax status or investment horizon. There is no representation or warranty as to the current accuracy of, nor liability for, decisions based on such information.
Certain information contained in this document constitutes “forward-looking statements,” which can be identified by the use of forward-looking terminology such as “may,” “will,” “should,” “expect,” “anticipate,” “target,” “project,” “estimate,” “intend,” “continue” or “believe,” or the negatives thereof or other variations thereon or comparable terminology. Forward-looking statements are inherently subject to, among other things, risks, uncertainties and assumptions regarding currencies, economic growth, current and expected conditions, and other factors that are believed to be appropriate in the circumstances which could cause actual events, results, performance or prospects to differ materially from those expressed in, or implied by, these forward-looking statements. Readers are cautioned not to place undue reliance on these forward-looking statements.
The MSCI information may only be used for your internal use, may not be reproduced or redisseminated in any form and may not be used as a basis for or a component of any financial instruments or products or indices. None of the MSCI information is intended to constitute investment advice or a recommendation to make (or refrain from making) any kind of investment decision and may not be relied on as such. Historical data and analysis should not be taken as an indication or guarantee of any future performance analysis, forecast or prediction. The MSCI information is provided on an “as is” basis and the user of this information assumes the entire risk of any use made of this information. MSCI, each of its affiliates and each other person involved in or related to compiling, computing or creating any MSCI information (collectively, the “MSCI parties”) expressly disclaims all warranties (including, without limitation, any warranties of originality, accuracy, completeness, timeliness, non-infringement, merchantability and fitness for a particular purpose) with respect to this information. Without limiting any of the foregoing, in no event shall any MSCI Party have any liability for any direct, indirect, special, incidental, punitive, consequential (including, without limitation, lost profits) or any other damages. (www.msci.com).
The S&P/TSX Index is a product of S&P Dow Jones Indices LLC or its affiliates (“SPDJI”) and TSX Inc., and has been licensed for use by Letko, Brosseau & Associates Inc. Standard & Poor’s® and S&P® are registered trademarks of Standard & Poor’s Financial Services LLC (“S&P”); Dow Jones® is a registered trademark of Dow Jones Trademark Holdings LLC (“Dow Jones”); and these trademarks have been licensed for use by SPDJI and sublicensed for certain purposes by Letko, Brosseau & Associates Inc. TSX® is a registered trademark of TSX Inc., and have been licensed for use by SPDJI and Letko, Brosseau & Associates Inc. Letko, Brosseau & Associates Inc.’s product is not sponsored, endorsed, sold or promoted by SPDJI, Dow Jones, S&P, their respective affiliates, or Bloomberg and none of such parties make any representation regarding the advisability of investing in such product(s) nor do they have any liability for any errors, omissions, or interruptions of the S&P/TSX Index.
Concerned about your portfolio?
Subscribe to Letko Brosseau’s newsletter and other publications: