 Canada - FR
 U.S. - EN
Economic and Capital Markets Outlook
October 2026
- While challenges abound, we expect economic resilience to persist. We forecast global real GDP to advance by 3.3% in 2027, compared with 3.0% in 2026.
- Solid consumer spending and business investment continue to anchor the U.S. economy, though an uncertain policy backdrop could temper growth in the year ahead. We anticipate U.S. real GDP growth will moderate to around 2.0% in 2027.
- The aggregate impact of renewed trade tensions on the Canadian economy appears manageable. We forecast Canadian real GDP growth of about 1.5% in 2027.
- Tighter monetary policy and challenging domestic conditions weigh on the Eurozone’s outlook. We expect the region’s real GDP growth to average near 1.0% in 2027.
- The performance of exports and scale of additional stimulus will be key for China to achieve the IMF’s real GDP growth forecast of 4.1% in 2027. In aggregate terms, activity for the Emerging Markets as a whole is expected to firm to 4.5% in 2027, per IMF estimates.
- Elevated earnings estimates appear to be a driver of equity markets. In this environment, we continue to emphasize price discipline, careful stock selection and diversification.
- We have taken advantage of the recent sharp rise in yields by adding medium-term bonds of high credit quality, slightly increasing our portfolio duration. As for overall asset allocation, we do not advocate any major changes at this juncture.
Summary
Recent readings of economic data confirm that the global economy is on track for a healthy expansion in 2026. This is despite headwinds from a sustained period of high oil prices, erratic U.S. trade policies, and more recently, pressures in bond markets. While challenges abound, we believe the economic resilience of past years will prevail again in 2027. Our base case forecast is for world real GDP to advance by 3.3% in 2027, compared to 3.0% in 2026.
We acknowledge that trends may diverge on a country-by-country basis given that energy market disruptions and tariff scenarios vary considerably by geography. In addition, with blockades limiting oil and gas shipments from the Middle East, inflation is at risk of broadening and becoming more persistent. However, we see appreciable supports to global activity. Robust AI investments are lifting both GDP and global equity markets, with the latter helping to sustain positive wealth effects. Fiscal policy remains accommodative in most major economies, and, on balance, benchmark interest rates are moderately stimulative.
In our view, negative swings in sentiment pose the biggest risk going forward. Historically high valuations and elevated consensus earnings estimates seem like a high bar given our expectations of moderate real GDP growth and geopolitical uncertainty. Meanwhile, higher global bond yields present another complication to the outlook for equities. After the recent rise in yields, fixed income assets once again provide a credible alternative from an allocation standpoint.
Potentially volatile periods such as these reinforce the importance of maintaining a disciplined risk management framework and principled investment strategy. We continue to believe that the optimal approach is an active strategy that emphasizes price sensitivity, diversification, and careful stock and bond selection.
U.S. set for mild deceleration
U.S. real GDP advanced 0.6% quarter-on-quarter in Q2. Household spending rose (+0.9%) and fixed investment surged (+1.9%), offsetting weakness in government expenditures (0.0%) and net exports
(-7.8%). In annual terms, real aggregate output increased 2.2% compared to a year ago.
While the U.S. economy has so far remained relatively steady, activity is likely to moderate through the remainder of the year. Employment growth has been volatile, and despite a bounce in August, hiring cooled in recent months. Since June, job gains averaged 71,000 per month, down from an average of 142,000 in the preceding three-month period.
That said, labour market momentum has waned without a material uptick in joblessness. August’s unemployment rate was 4.1%, near a historical low. Recent data reflects less demand for workers, but tightened immigration controls have limited labour force growth in the past year – a dynamic that has helped keep unemployment stable.
Despite less hiring, prospects for consumer spending remain constructive. Household net worth stood at a record $186 trillion midway through 2026, reflecting strong stock market performance. The top income quintile of Americans, who represent 40% of all private spending, are well positioned to continue driving aggregate consumer demand.
Apart from household consumption, U.S. business spending has also been a key growth support, thanks in part to AI-related spending. Private fixed investments contributed 1.4 percentage points to real GDP growth in the second quarter. Aggregate corporate profits rose 21.5% year-on-year in the same period, and the strong financial position of U.S. firms suggests the economy will continue to benefit from robust capital expenditures in the coming months.
Weighing the supportive environment for consumer spending and business investment against a backdrop of trade policy uncertainty, fiscal pressures, and rising Federal Reserve rate hike expectations, we conclude the U.S. economy is poised for a moderate deceleration. We forecast U.S. real GDP growth to slow to around 2.0% in 2027 (Table 1).
Global Real GDP Growth
| 2026 | 2027 | |
| World | 3.0%* | 3.3%* |
| Advanced Economies | 1.7% | 1.8% |
| United States | 2.2%* | ~2.0%* |
| Canada | 1.0%* | ~1.5%* |
| Eurozone | 0.5%* | ~1.0%* |
| United Kingdom | 1.0% | 1.3% |
| Japan | 0.6% | 0.7% |
| Emerging Economies | 3.8% | 4.5% |
| China | 4.6% | 4.1% |
| India | 6.4% | 6.7% |
| Brazil | 2.4% | 2.2% |
| Mexico | 1.2% | 1.9% |
Canada well positioned for new headwinds
Canada recorded the fastest rate of expansion among G-7 economies in the second quarter. Real GDP rose 0.8% quarter-on-quarter as household spending (+0.8%), business investment (+2.3%) and exports (+3.6%) recorded notable expansions. Since then, renewed trade tensions have complicated an otherwise promising outlook.
After negotiations broke down in August, the U.S. imposed 50% tariffs on C$28 billion of Canadian goods and Canada retaliated with equal counter-tariffs. The U.S.’s escalation raised the effective tariff rate on Canadian goods from approximately 3% to 6%. This compares to an average tariff rate on imports of around 7% from other U.S. trading partners. Moreover, around 80% of Canadian exports will continue to enter the U.S. duty-free.
While consequences will still be acute for tariffed industries, fiscal policy is positioned to cushion the impact. On top of previously announced measures (C$25 billion since Q1 2025), the Canadian government has committed an additional C$7.5 billion in worker and business supports. Furthermore, revenues collected from tariffs on U.S. goods will be redeployed as supplementary stimulus. Despite these actions, the fiscal deficit should remain between 2-3% of GDP, which highlights ample space for additional stimulus.
We recognize the current climate of uncertainty and the potential for further escalation is negatively impacting consumer and business sentiment, and this could spill over into lower spending. Nonetheless, the impact of new tariffs appears manageable, and our base case is for the Canadian economy to stay on a positive growth track for 2027.
Alongside timely fiscal stimulus, monetary policy is also supportive. Looking ahead, a subdued core inflation rate (2.1% in August) suggests Canada’s monetary backdrop will remain moderately stimulative for some time. Trade pressures are a clear headwind, but given solid domestic demand and a conducive policy environment, only a mild deceleration is anticipated. We forecast Canadian real GDP growth of around 1.5% in 2027.
Eurozone prospects remain challenging
Eurozone real GDP advanced 0.6% quarter-on-quarter in Q2. Spain led growth among the region’s major economies with an expansion of 0.7%, while output increased 0.3% in Germany and 0.2% in Italy. France was the exception, recording no change in output from Q1. Subdued trend growth leaves the Eurozone with a limited buffer against further shocks.
Headline inflation accelerated to 3.2% year-on-year in August, matching May’s two-and-a-half-year high. The Eurozone remains particularly exposed to energy inflation pressures. As a consequence, the ECB has diverged from peer central banks by raising interest rates twice since the U.S.-Iran war began. We see scope for an additional 25 basis point benchmark rate increase by year end.
A closer look at domestic conditions across the Eurozone’s major economies reveals additional risks to the outlook. In France, political uncertainty is complicating efforts to restore public finances and is placing upward pressure on government borrowing costs. France’s fiscal deficit is forecast to remain at 5.0% of GDP in 2026, while public debt approaches 120%. Italy faces a different challenge as support from the E.U.’s temporary Recovery and Resilience Facility winds down. As the programme’s largest beneficiary, this fading investment impulse will weigh on an economy already expected to record subdued growth in 2027.
Regional prospects are not uniform, however. We have previously highlighted the stimulative contribution of higher German infrastructure and defence spending. These commitments are multi-year in nature and will be disbursed progressively, providing a steady, rather than sudden, impulse to regional activity throughout the forecast horizon.
The Eurozone labour market has also proven durable. In August, the unemployment rate stood at a historically low 6.4%. Concerns that higher input costs and softer demand would force firms into job cuts have not materialized. Employers have instead retained staff, in part reflecting years of recruitment difficulty across several sectors, which has left firms reluctant to shed workers they may struggle to replace. The absence of stress in the labour market should underpin household incomes and consumer spending.
In our view, these supports are meaningful but insufficient to offset the headwinds facing the region. On balance, restrictive monetary policy, fiscal strain in France, and tapering investments will continue to weigh on activity. We expect Eurozone real GDP to expand by approximately 1.0% in 2027, with risks tilted to the downside.
Trade and stimulus critical for China’s outlook
China’s economy expanded 4.3% year-on-year in Q2, marking a slowdown from the previous quarter. While exports and industrial production have shown steady strength since then, the wider domestic economy remains subdued.
The external strength underpinning this performance shows no signs of cooling. During the first eight months of the year, exports climbed 19.3% against a year ago, while imports soared 26.7%. The trade surplus rose to $806 billion in the same period, placing the annual figure on track to surpass last year’s record of $1.2 trillion. Industrial production advanced by 5.3% year-on-year, reflecting the close link between China’s export sector and industrial complex.
Elsewhere, consumer demand remained tepid. Retail sales increased just 0.4% year-on-year in August and 1.1% during the first eight months of the year. Retail categories that were focal points of last year’s 300 billion RMB consumer subsidy scheme have accounted for much of the weakness to date. Indeed, excluding automobiles, retail sales would have increased by 2.7% over this period. Consumer indicators should improve somewhat as base effects linked to last year’s stimulus fade.
Investment is another area of the domestic economy that could see modest improvements going forward. Fixed asset investment declined 7.2% year-on-year during the first eight months of 2026. However, the recent release of funds from China’s new 800 billion RMB policy financing tool could help stabilize infrastructure spending – a key component of total fixed asset investment.
We view continued strength in export-linked sectors and additional investment-focused policy supports as prerequisites for China to achieve the IMF’s growth forecast of 4.1% in 2027.
Varied growth trajectories in emerging markets
In India, real GDP advanced 7.8% year-on-year in Q2. Growth has proven durable amid higher energy prices and India is on course to retain its status as the fastest growing G-20 economy. Real GDP is expected to expand by 6.7% in 2027, per IMF estimates.
Mexico grew 2.1% in real annual terms in Q2, reflecting resilience to persistent trade uncertainty with the U.S. Looking ahead, accommodative financial conditions, low unemployment and healthy real wage growth should continue to anchor activity in positive territory. The IMF projects real GDP to expand by 1.9% in 2027.
Activity remained stable in Brazil as real GDP rose 2.0% year-on-year in the second quarter. Elevated government expenditures have boosted household spending but also led to wider public deficits over the past several months. While the IMF projects real GDP growth of 2.2% in 2027, in our view, Brazil’s outlook depends heavily on the direction of fiscal policy following October’s general election.
While economic challenges persist at the country level, aggregate emerging market growth is projected to firm. The outlook is underpinned by notable momentum in India and improving conditions across several smaller economies that faced energy-related headwinds in 2026. The IMF anticipates emerging market real GDP growth of 4.5% in 2027, up from 3.8% in 2026.
Markets fluctuate amid heightened uncertainties
Global equities advanced to all-time highs in the third quarter, despite several bouts of volatility. The year-to-date total return of the S&P 500 was 16.8% (in Canadian dollar terms), while the S&P/TSX (13.0%), MSCI ACWI (17.1%), and MSCI Emerging Markets (27.8%) all closed the period with double-digit returns.
Robust corporate profitability has been a key driver of the market’s rise. Indeed, the majority of S&P 500 industry groups saw notable earnings growth to date (Table 2). The strength and breadth of company earnings have been impressive, especially considering a complex and uncertain backdrop.
S&P 500 Operating Earnings Per Share* - 2026 year-on-year change, by sector
| Energy | 90.5% |
| Communication Services | 56.8% |
| Information Technology | 52.3% |
| Materials | 36.8% |
| Consumer Discretionary | 35.3% |
| Financials | 14.4% |
| Utilities | 12.9% |
| Industrials | 12.3% |
| Real Estate | 10.1% |
| Consumer Staples | 7.6% |
| Health Care | 2.5% |
| Total | 32.0% |
Nevertheless, aggregate earnings estimates for the year ahead seem lofty. Consensus forecasts are for S&P 500 profits to rise 15.4% year-on-year, a highly optimistic outlook in a 1-2% real GDP growth environment. Even with these high embedded earnings forecasts, the S&P 500 currently trades at 18.6 times 2027 earnings, an elevated multiple compared to its long-term average of 16.1. This ongoing disconnect between economic fundamentals and market expectations highlights a significant underlying vulnerability in equity markets.
The current market landscape highlights the importance of price discipline, careful stock selection and diversification. We have deployed capital selectively during periods of volatility and our balanced portfolios remain tilted in favour of equities. On balance, we believe our global strategy remains reasonably valued at 12.8 times 2027 earnings and possesses strong medium- to long-term earnings growth potential regardless of near-term challenges.
Turning to fixed income, global bond yields reached multi-year highs in the third quarter. The selloff in U.S. Treasuries is widely seen as a sign of building inflationary pressures. Although the U.S.-Iran war has reignited energy inflation fears, bond market metrics do not appear to reflect these concerns. Yields have risen across the curve in 2026 – with the 10-year yield climbing more than 100 basis points (bps) from its late-February low – yet inflation expectations have remained stable at around 2.3% since 2021.
The principal driver of higher U.S. government bond yields has instead been an increase in real yields (nominal yields adjusted for inflation). Fiscal slippage may have also contributed to the move, yet this is not a new phenomenon as U.S. budget deficits have routinely exceeded $1.5 trillion for several years now. In our view, higher U.S. real yields primarily reflect the massive scale of economy-wide debt issuance – including both government and corporate financing needs. Funding requirements associated with persistent fiscal deficits were already sizeable and new, heavy corporate borrowing is adding to the competition for capital. AI-related debt issuance has accelerated from a low base and is projected to reach more than $500 billion by the end of 2026. Ultimately, the market has had to absorb a much larger flow of bond issuance than in past years, and investors are demanding greater compensation to do so.
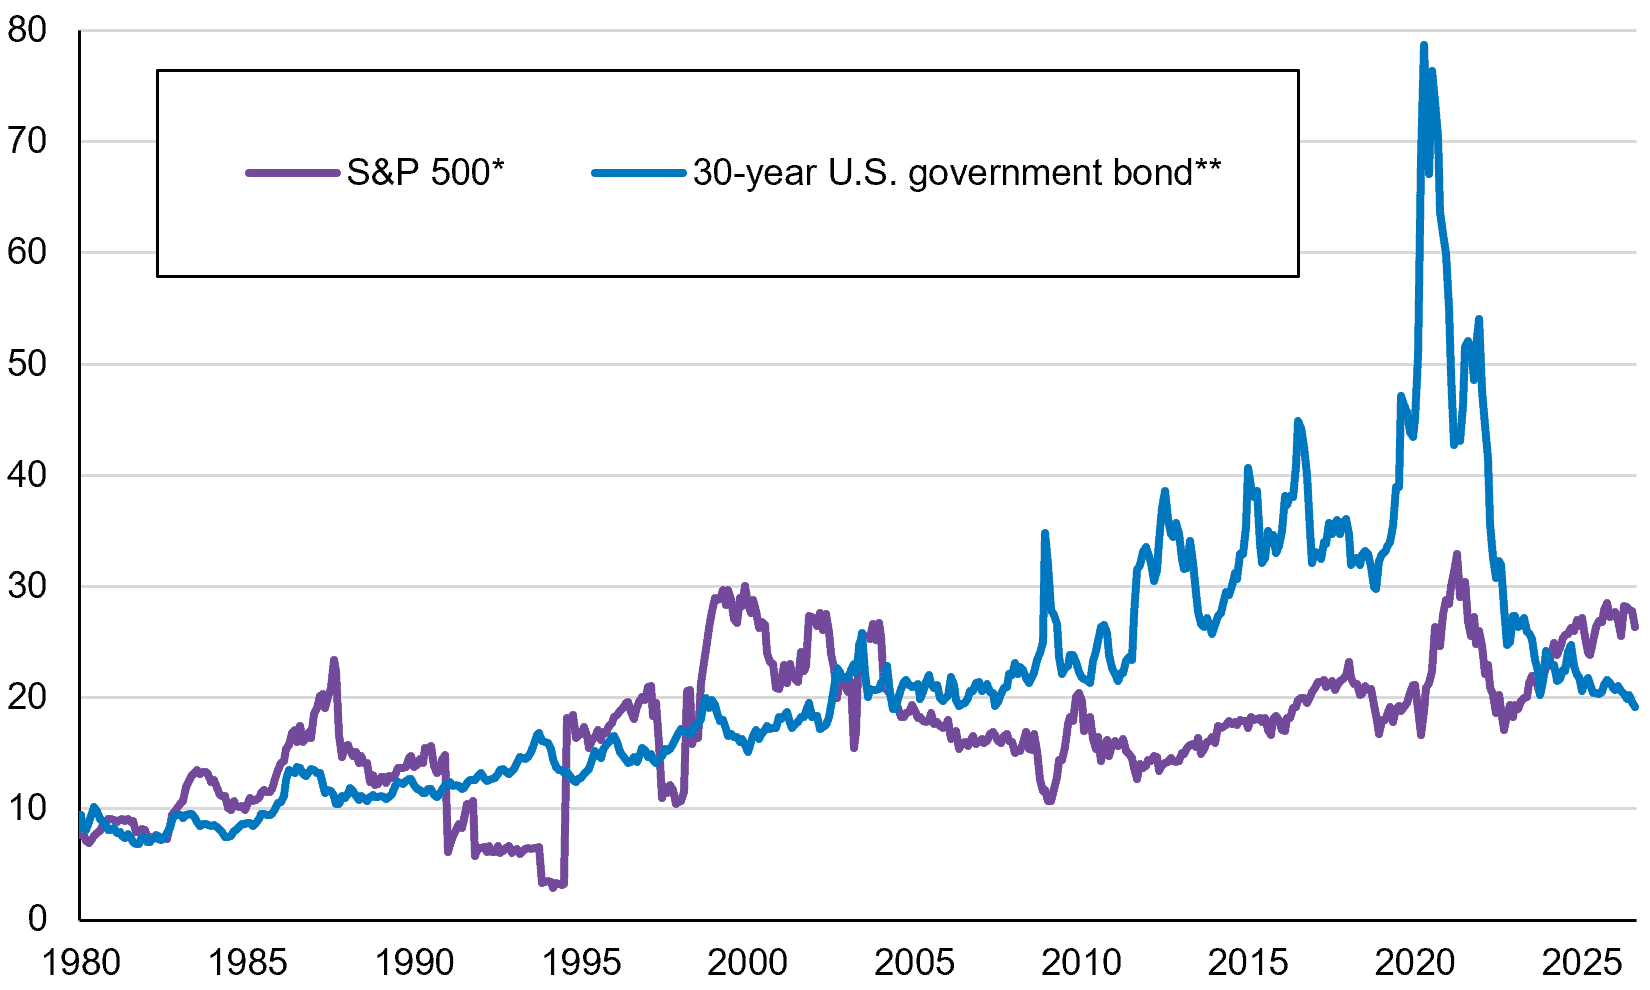
One notable consequence of higher U.S. bond yields is that the risk/reward trade-off between American equities and fixed income assets has narrowed. At present, a real yield of 3% provides an opportunity to earn a nominal yield of 5-6%, assuming 2-3% inflation. Meanwhile, the P/E multiple of long U.S. bonds, at 19.2x, is now below that of U.S. equities, something last seen in the early 2000s (Chart 1).
Higher yields elsewhere in the G7 mirror the selloff in U.S. Treasuries, although to a varied extent. Since their relative lows in February, ten-year government bond yields have risen by more than 100 bps in the U.K. and around 95 bps in Japan. In Canada, the
10-year government bond yield climbed 86 bps, and the 30-year rose 67 bps in the same period.
We have long argued that the fair value of medium-and long-term Canadian bonds was lower than prevailing levels and our reluctance to expose portfolios to the longer end of the yield curve has been rewarded. In past months, however, we have taken advantage of this repricing by adding medium-term bonds of high credit quality, slightly increasing our portfolio duration. As for overall asset allocation, we do not advocate any major changes at this juncture.
P/E Multiple Comparison: U.S. Equities vs. Long-term U.S. Treasuries
The information and opinions expressed herein are provided for informational purposes only, are subject to change and are not intended to provide, and should not be relied upon for, accounting, legal or tax advice or investment recommendations. Any companies mentioned herein are for illustrative purposes only and are not considered to be a recommendation to buy or sell. It should not be assumed that an investment in these companies was or would be profitable. Unless otherwise indicated, information included herein is presented as of the dates indicated. While the information presented herein is believed to be accurate at the time it is prepared, Letko, Brosseau & Associates Inc. cannot give any assurance that it is accurate, complete and current at all times.
Where the information contained in this presentation has been obtained or derived from third-party sources, the information is either from recognized financial and statistical reporting services or similar sources believed to be reliable, but the firm has not independently verified such information. No representation or warranty is provided in relation to the accuracy, correctness, completeness or reliability of such information. Any opinions or estimates contained herein constitute our judgment as of this date and are subject to change without notice.
Past performance is not a guarantee of future returns. All investments pose the risk of loss and there is no guarantee that any of the benefits expressed herein will be achieved or realized.
The information provided herein does not constitute investment advice and it should not be relied on as such. It should not be considered a solicitation to buy or an offer to sell a security. It does not take into account any investor’s particular investment objectives, strategies, tax status or investment horizon. There is no representation or warranty as to the current accuracy of, nor liability for, decisions based on such information.
Certain information contained in this document constitutes “forward-looking statements,” which can be identified by the use of forward-looking terminology such as “may,” “will,” “should,” “expect,” “anticipate,” “target,” “project,” “estimate,” “intend,” “continue” or “believe,” or the negatives thereof or other variations thereon or comparable terminology. Forward-looking statements are inherently subject to, among other things, risks, uncertainties and assumptions regarding currencies, economic growth, current and expected conditions, and other factors that are believed to be appropriate in the circumstances which could cause actual events, results, performance or prospects to differ materially from those expressed in, or implied by, these forward-looking statements. Readers are cautioned not to place undue reliance on these forward-looking statements.
The MSCI information may only be used for your internal use, may not be reproduced or redisseminated in any form and may not be used as a basis for or a component of any financial instruments or products or indices. None of the MSCI information is intended to constitute investment advice or a recommendation to make (or refrain from making) any kind of investment decision and may not be relied on as such. Historical data and analysis should not be taken as an indication or guarantee of any future performance analysis, forecast or prediction. The MSCI information is provided on an “as is” basis and the user of this information assumes the entire risk of any use made of this information. MSCI, each of its affiliates and each other person involved in or related to compiling, computing or creating any MSCI information (collectively, the “MSCI parties”) expressly disclaims all warranties (including, without limitation, any warranties of originality, accuracy, completeness, timeliness, non-infringement, merchantability and fitness for a particular purpose) with respect to this information. Without limiting any of the foregoing, in no event shall any MSCI Party have any liability for any direct, indirect, special, incidental, punitive, consequential (including, without limitation, lost profits) or any other damages. (www.msci.com).
The S&P/TSX Index is a product of S&P Dow Jones Indices LLC or its affiliates (“SPDJI”) and TSX Inc., and has been licensed for use by Letko, Brosseau & Associates Inc. Standard & Poor’s® and S&P® are registered trademarks of Standard & Poor’s Financial Services LLC (“S&P”); Dow Jones® is a registered trademark of Dow Jones Trademark Holdings LLC (“Dow Jones”); and these trademarks have been licensed for use by SPDJI and sublicensed for certain purposes by Letko, Brosseau & Associates Inc. TSX® is a registered trademark of TSX Inc., and have been licensed for use by SPDJI and Letko, Brosseau & Associates Inc. Letko, Brosseau & Associates Inc.’s product is not sponsored, endorsed, sold or promoted by SPDJI, Dow Jones, S&P, their respective affiliates, or Bloomberg and none of such parties make any representation regarding the advisability of investing in such product(s) nor do they have any liability for any errors, omissions, or interruptions of the S&P/TSX Index.
Bloomberg Finance L.P. Used with permission of Bloomberg Finance L.P.
Concerned about your portfolio?
Subscribe to Letko Brosseau’s newsletter and other publications: