 Canada - FR
 U.S. - EN
Economic and Capital Markets Outlook
January 2026
Q&A with our Economics Team
The global economy has continued to advance despite a number of major headwinds in recent years.
In 2022, the Russia-Ukraine war imperiled commodity trade links and worsened already-high inflation dynamics. Aggressive central bank rate hikes and an inversion of the yield curve triggered recession calls throughout 2023 and 2024. Last year, the U.S. trade war became the latest addition to this list of challenges. While the world appears to be moving past the 2025 trade shock and activity continues to demonstrate resilience, questions remain regarding the path forward.
In this edition of our Economic and Capital Markets Outlook, we take the opportunity to address some of the most crucial questions and concerns that you have shared with us about the global economy and financial markets.

Joël Kaczor, M.Sc. Finance, CFA®
Chief Economist and Senior Portfolio Manager

Wesley Scanterbury, M.A. Economics, CFA®
Senior Economist and Portfolio Manager
Is the U.S. economy poised for a boom or bust in 2026?
In 2025, the U.S. economy was buffeted by a historic rise in tariffs, an abrupt downsizing of the federal workforce and the longest government shutdown on record. Yet, activity surprised to the upside. The economy is estimated to have grown by 2.0% in 2025. Looking ahead, narratives around the individual drivers of the economy’s solid performance point in very different directions.
Spending on artificial intelligence was a positive contributor to growth in 2025. Is this trend sustainable or will a sharp downturn materialize if tech investments dry up?
Investment in data centres, IT equipment, software, and research and development spending made significant contributions to U.S. economic activity over the past several quarters. Indeed, AI-related expenditures led to real GDP growth being about 0.5 percentage points higher in the first 3 quarters of the year than it otherwise would have been. Entering 2026, the importance of business AI spending to the outlook for the U.S. economy remains very much debated.
Positive estimates point to between $500 billion and $700 billion of additional AI-related investments this year, equivalent to 1.5-2.0% of nominal GDP. However, it remains unclear whether this will come at the expense of other types of capital expenditure, thereby mitigating AI’s contribution to growth. On the other hand, pessimistic forecasts assume that a fall in AI-related investments will undermine the wider economy.
We believe these assessments overlook the breadth of domestic demand. Capital spending on durable goods excluding AI rose 1.7% year-on-year in Q3 and could be even stronger in 2026 if spending on AI is redirected elsewhere. Accordingly, we do not expect AI spending to impart a material effect on our baseline forecast for the U.S. economy in 2026.
We believe a more important question with respect to AI is its longer-term effect on the overall economy. While it is too soon to predict with high confidence what structural impacts AI will have, productivity gains could be modest in the near-to-medium term. Empirical evidence from periods of technological innovation spanning the industrial revolution to the internet age provides significant takeaways. Transitions from capital spending to appreciable productivity gains take time and changes in the nature of work have historically yielded only subtle productivity benefits. Critically, the effects of technological changes vary greatly across sectors, dampening the ultimate impact on overall GDP growth. In short, the impact of AI may certainly be positive for productivity but estimates of an unprecedented boom in economic growth may be overstated.
Gains in employment have also been an important factor for growth. How concerning are softening U.S. labour market trends?
Employment growth slowed noticeably last year. Job gains moderated from 209,000 per month in Q4 2024 to 55,000 per month between January-November 2025. This pronounced step-down in net hiring has sparked fears that the U.S. labour market is rapidly deteriorating following years of strength.
Although recent data reflects less demand for workers, it is important to consider key changes on the supply side of the equation. Tightened immigration controls have dramatically tempered labour force growth in the past year. According to the U.S. Federal Reserve, the so-called breakeven rate for job creation – the number of new jobs required each month to keep unemployment stable – is estimated to be between zero and 50,000 at present, compared to a range of 150,000 to 200,000 during the Biden administration.
A realignment of labour supply and demand at lower levels helps explain why the unemployment rate has been broadly stable and remains historically low at just 4.6% in November. Given current immigration policies, labour market conditions are likely to stay modestly tight through 2026.
Is the U.S. consumer on solid ground or shaky footing?
As we have chronicled in the past year, household spending is fragmented, with high-income Americans increasingly driving the majority of consumption. Whether or not the top-earning households can sustain their spending habits is central to the outlook for the U.S. economy.
Household net worth stood at $167 trillion midway through 2025 and likely climbed higher as the year came to a close, given strong stock market performance. In our assessment, the top income quintile of Americans – accounting for 40% of total private expenditures – are well positioned to continue to make a positive contribution to overall consumer spending. For the middle class, tax refunds related to the One Big Beautiful Bill Act will provide support to disposable incomes in the first half of 2026. Meanwhile, the Federal Reserve is expected to deliver two additional 25 basis point interest rate cuts in 2026, suggesting financial conditions will remain accommodative for some time.
Prospects for consumer spending – the largest component of U.S. GDP – are constructive. While we believe that growth will decelerate in 2026, we envision a gradual, rather than abrupt, slowdown. Growth should remain robust in the first half of the year and decelerate thereafter. For the full year, we forecast U.S. real GDP growth between 1.0-2.0% in 2026 (Table 1).
Global Real GDP Growth
| 2025 | 2026 | |
| World | 3.2% | 3.1%* |
| Advanced Economies | 1.6% | 1.6% |
| United States | 2.0% | 1.0-2.0%* |
| Canada | 1.2% | 1.0-2.0%* |
| Eurozone | 1.2% | ~1.0%* |
| United Kingdom | 1.3% | 1.3% |
| Japan | 1.1% | 0.6% |
| Emerging Economies | 4.2% | 4.0% |
| China | 4.8% | 4.2% |
| India | 6.6% | 6.2% |
| Brazil | 2.4% | 1.9% |
| Mexico | 1.0% | 1.5% |
What’s next for the Canadian economy?
Canada fared better than expected at the onset of the U.S. trade war. While specific sectors such as the automotive, lumber, steel and aluminum industries have faced the brunt of high tariffs, Canada-United-States-Mexico Agreement (CUSMA) exemptions resulted in lower effective tariff rates (<5%) than the announced rates (35%) on most Canadian exports. Currently, close to 90% of Canadian exports to the U.S. remain tariff-exempt.
The tri-lateral free trade agreement is scheduled for a joint review beginning in July 2026, suggesting that trade policy will remain uncertain in the near term. Although Canada faces external pressures, the economy possesses several offsetting domestic supports. First, the labour market has exhibited strength in recent months. From September through November, the economy added a cumulative 181,000 jobs. Robust workforce growth pushed the unemployment rate from 7.1% to 6.5% over the same period, a sixteen-month low. Meanwhile, following a run of record-high immigration, labour force growth is beginning to taper, somewhat similar to the U.S. This bodes well for wages, and we anticipate that average hourly earnings (+3.6% year-on-year in November) will continue to outpace inflation (2.2%).
Second, Ottawa’s much-anticipated federal budget outlines a 2025-26 deficit of C$78.3 billion (2.5% of GDP) reflecting a sizeable and multifaceted stimulus push. Indeed, public capital expenditures are planned to double from 1% of GDP to 2% and will be allocated across infrastructure, defense spending and housing. The budget signals an increase in national debt. However, Canada’s low starting point – net debt is just 8.3% of GDP – means fiscal sustainability should not be a problem.
Lastly, the Canadian economy is set to benefit from looser financial conditions in 2026. Back-to-back interest rate cuts from the Bank of Canada in September and October have left the benchmark interest rate at a moderately stimulative 2.25%.
We are optimistic that the Canadian economy will undergo an upswing in 2026. Job gains and healthy real wage growth underscore solid consumer fundamentals, which are further bolstered by equity-driven wealth effects. Trade uncertainty will persist in the year ahead but is countered by supportive fiscal and monetary policy. Consequently, we forecast Canadian real GDP growth to accelerate to between 1.0-2.0% in 2026.
Where is the Canadian dollar headed in 2026?
Entering 2026, the Loonie-greenback exchange rate remains a subject of concern for Canadian households and businesses alike. While it is challenging to accurately predict short-term swings of the CAD, or any currency for that matter, it is essential that investors understand the key factors that will influence the CAD/USD exchange rate in 2026 and beyond.
A unique feature of the past two years is that the Bank of Canada cut its benchmark interest rate well ahead of the U.S. Federal Reserve. Indeed, the BoC lowered its policy rate by 275 basis points compared to the Federal Reserve’s 175 basis point easing cycle over the same period. Short-term rate differentials explain some of the recent pressure on the CAD relative to the USD. Looking ahead, we anticipate interest rate dynamics will shift in favour of a stronger Canadian dollar. No further BoC rate cuts are expected during 2026, while further easing is likely in the U.S.
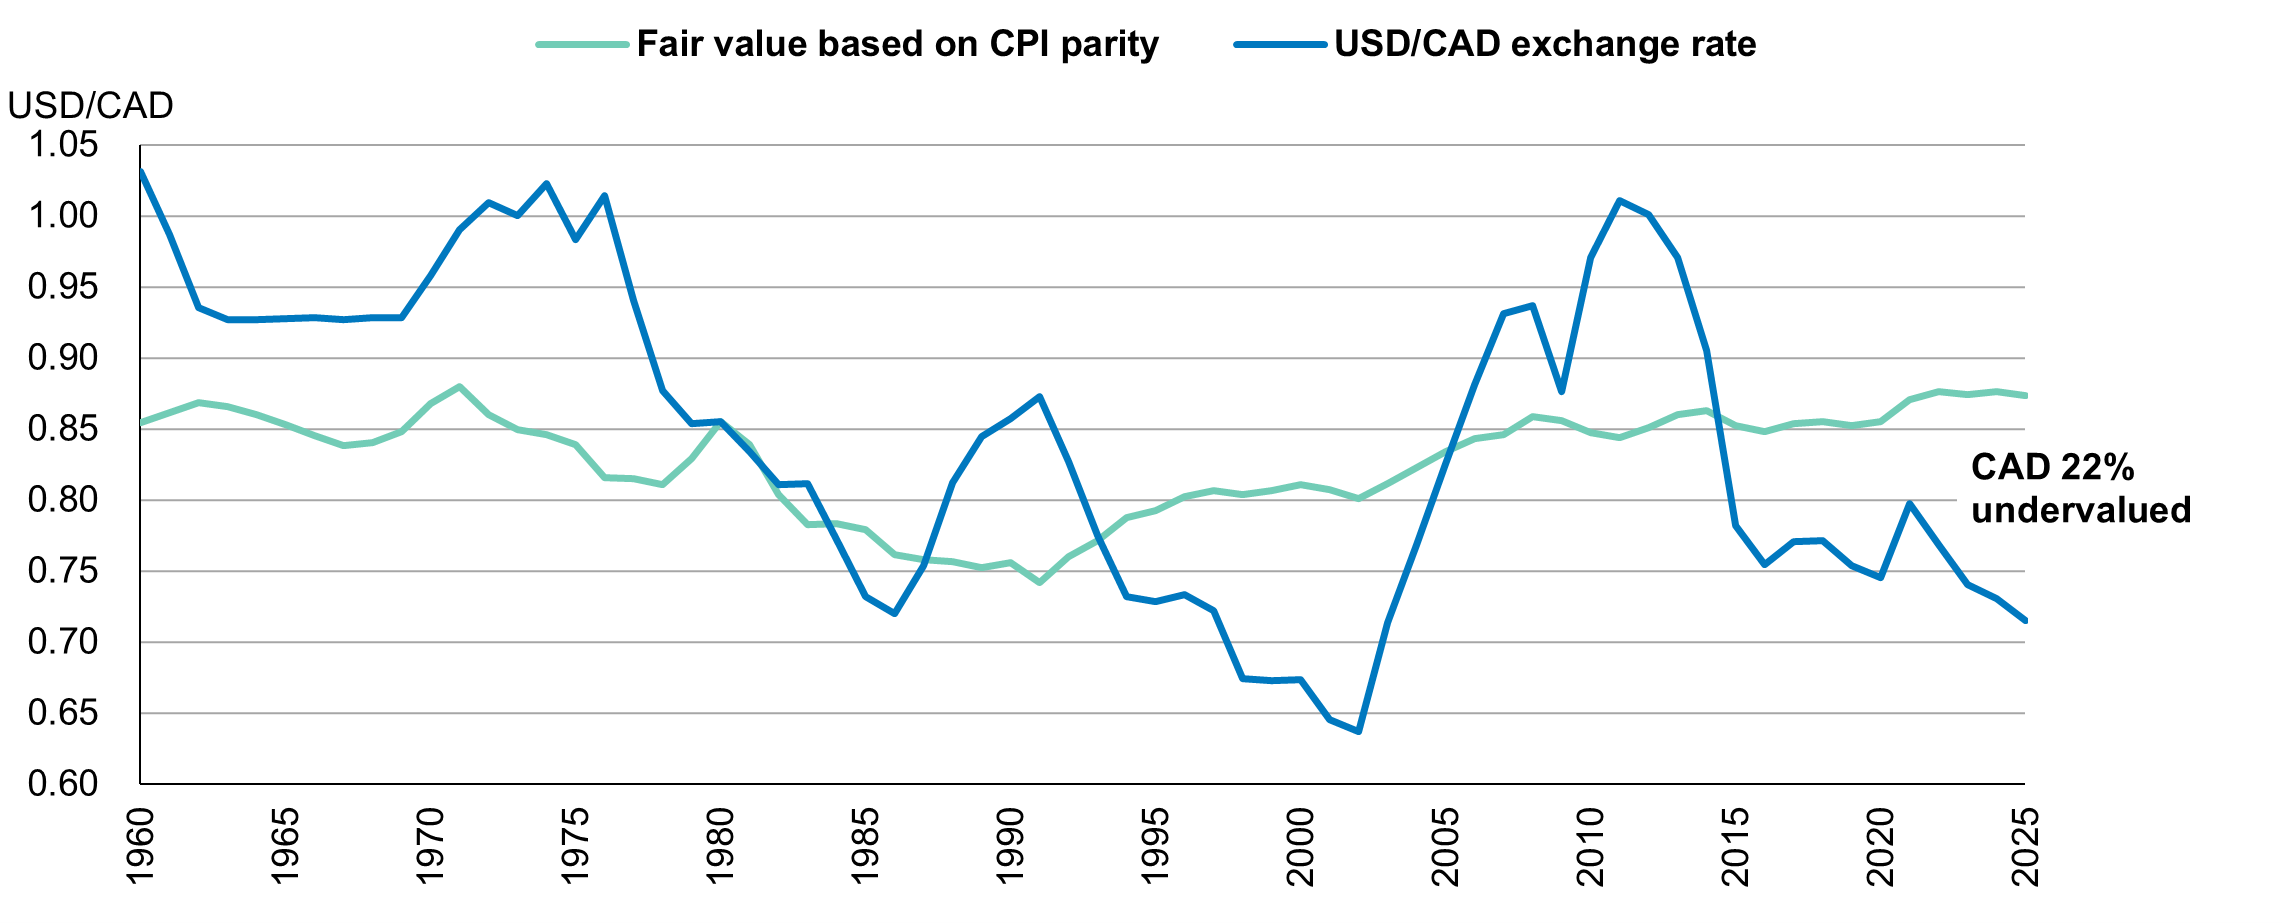
Trade uncertainty also presents a lingering risk to the Loonie’s outlook. However, we believe further downside is limited. Based on our purchasing power parity model estimate of fair value, the CAD is 22% undervalued compared to the USD (Chart 1). Put differently, the U.S. dollar is expensive, a view which holds across other major currencies. The USD appears overpriced by 11% relative to the Euro and trades 59% above parity with the Yen. We see potential for a moderately weaker USD in 2026 and are confident that the CAD, EUR and JPY offer meaningful long-run value.
U.S. Dollar vs. Canadian Dollar: Exchange rate and fair value
Can the Eurozone finally build some economic momentum?
Despite a protracted economic slump in Germany, tariff headwinds and French political uncertainty, the Eurozone economy continued to advance in 2025. Real GDP rose 1.4% in annual terms during the third quarter. Looking ahead, we believe downward risks to activity have diminished relative to a year ago.
Tariff disruptions have been worked through and the U.S.-E.U. trade deal agreed in July suggests trade flows and foreign investments could potentially stabilize soon. Meanwhile, the European Central Bank is likely to keep interest rates steady at 2% this year given progress on inflation. Borrowing costs have halved since mid-2024 and the Eurozone is poised to benefit from an uptick in credit growth.
On the fiscal front, recently announced budget plans confirmed our expectation of easing. Regional activity will be boosted by higher defense spending, as well as German infrastructure investments (1% of German GDP). These factors lead us to believe that Eurozone real GDP growth will remain around 1.0% in 2026.
What is the outlook for emerging markets growth?
Prospects for emerging markets are mixed due to differences in domestic conditions. Challenges and opportunities vary on a country-by-country basis.
While real GDP growth in China likely met the government’s target of about 5% in 2025, signs of softening activity in Q4 highlight pressure on policymakers to maintain momentum in the year ahead. In the eleven months to November, fixed asset investment slumped 2.6% year-on-year. Continued property sector weakness and anti-involution policies – aimed at arresting pockets of deflation and overcapacity – weighed heavily on capital spending. Encouragingly, the launch of a new RMB 500 billion policy financing tool for select projects could help spur fixed asset investment growth in 2026.
Actions are being taken to shore up domestic activity, and we expect to see more incremental consumer stimulus and investment support announced by monetary and fiscal authorities. On the external side, China’s trade surplus appears likely to narrow modestly from the record $1 trillion mark set last year. The IMF forecasts China’s real GDP growth to slow to 4.2% in 2026.
In India, real GDP surged 8.2% year-on-year in Q3. The fastest-growing major economy by a wide margin, India has been little effected by punitive U.S. tariffs. Robust consumer spending and service sector growth have outweighed export losses to date. While growth is expected to trend lower from current highs, India is on track for a healthy 6.2% real expansion in 2026, per IMF estimates.
Prospects vary in other key emerging markets. In Mexico, real GDP is expected to rebound in the year ahead. The domestic economy has held up well despite trade-related challenges and is set to benefit from lower interest rates. The IMF’s forecast is for Mexico’s real GDP to advance by 1.5% this year. Elsewhere, Brazil is expected to slow due to a protracted monetary tightening cycle, constrained fiscal policy and political uncertainty. The IMF anticipates real GDP growth will decelerate to 1.9% in 2026.
Overall, the outlook for emerging markets is characterized by divergent growth paths and challenges at the country level. In aggregate terms, however, regional activity is projected to remain broadly stable. The IMF forecasts emerging market real GPD growth of 4.0% in 2026.
What can be expected from stocks after such a strong run?
Equity markets climbed to new highs in the fourth quarter, capping a third consecutive year of double-digit gains. The S&P 500 rose 12.4% (total return in Canadian dollars), while the S&P/TSX was up 31.7%, MSCI ACWI 16.6%, and MSCI Emerging Markets 27.3%. The performance of global equities has been impressive, especially when considering these robust returns were delivered against a complex and uncertain backdrop.
While valuations have trended higher in the past year – the S&P 500 appears expensive at a forward P/E of 22x – strong corporate profitability has also been a key driver of market resilience. Indeed, the majority of S&P 500 industry groups saw notable earnings growth in 2025 (Table 2). We believe the wide breadth of positive corporate earnings should help cushion potential valuation downside in equities.
At the same time, aggregate earnings estimates seem elevated for the year ahead, given a conducive, though subdued, economic setup. Consensus forecasts are for S&P 500 profits to rise 18.1% year-on-year, a high-bar in a 1-2% real GDP growth environment. In our opinion, this disconnect between economic fundamentals and investor expectations highlights a significant risk still embedded in equity markets.
On balance, however, we believe our equity investments continue to provide attractive growth prospects over a 3-5-year horizon. Despite recording returns of 24.8% and 38.0% respectively last year, the LetkoBrosseau Global Equity and Emerging Markets Equity strategies trade at a compelling 13.1 and 10.7 times 2026 earnings. This is a substantial discount from the benchmark MSCI ACWI valuation of 18.9 times forward earnings and the MSCI Emerging Markets Index valuation of 13.2 times.
S&P 500 Operating Earnings Per Share
2025 year-on-year change (%)*
| Information Technology | 31.7% |
| Communication Services | 24.8% |
| Health Care | 18.6% |
| Materials | 14.7% |
| Industrials | 8.2% |
| Financials | 5.3% |
| Utilities | 1.5% |
| Consumer Discretionary | 0.6% |
| Real Estate | 0.4% |
| Consumer Staples | -1.3% |
| Energy | -10.7% |
In today’s uncertain environment, what is your asset allocation strategy?
Current market features, such as lofty valuations and optimistic earnings assumptions, necessitate a degree of caution from investors. We believe the most effective way to limit equity market risk in this environment is to focus on careful stock selection and continuously review our holdings for risks such as extended valuations and excessive exposures, among others.
Overall, we now hold a moderate level of cash in our portfolios and continue to exercise patience in the redeployment of capital. We are confident this measured approach will be rewarded in the medium term.
Turning to fixed income, we continue to minimize risks and focus on capital preservation in our bond holdings by prioritizing quality and avoiding long duration securities. At this juncture, we do not advocate any major changes in portfolio structure, and our balanced mandates remain near target asset allocations.
Concerned about your portfolio?
Subscribe to Letko Brosseau’s newsletter and other publications: